Stack
User can turn on Stack to view multiple Y-Axis values on separated scales in views. Stack is available in most of Line Chart Styles.
- Steps to use Stack in Line Chart:
- To turn on Stack, open a Line Chart and click the [
 ] icon.Stack Line Chart
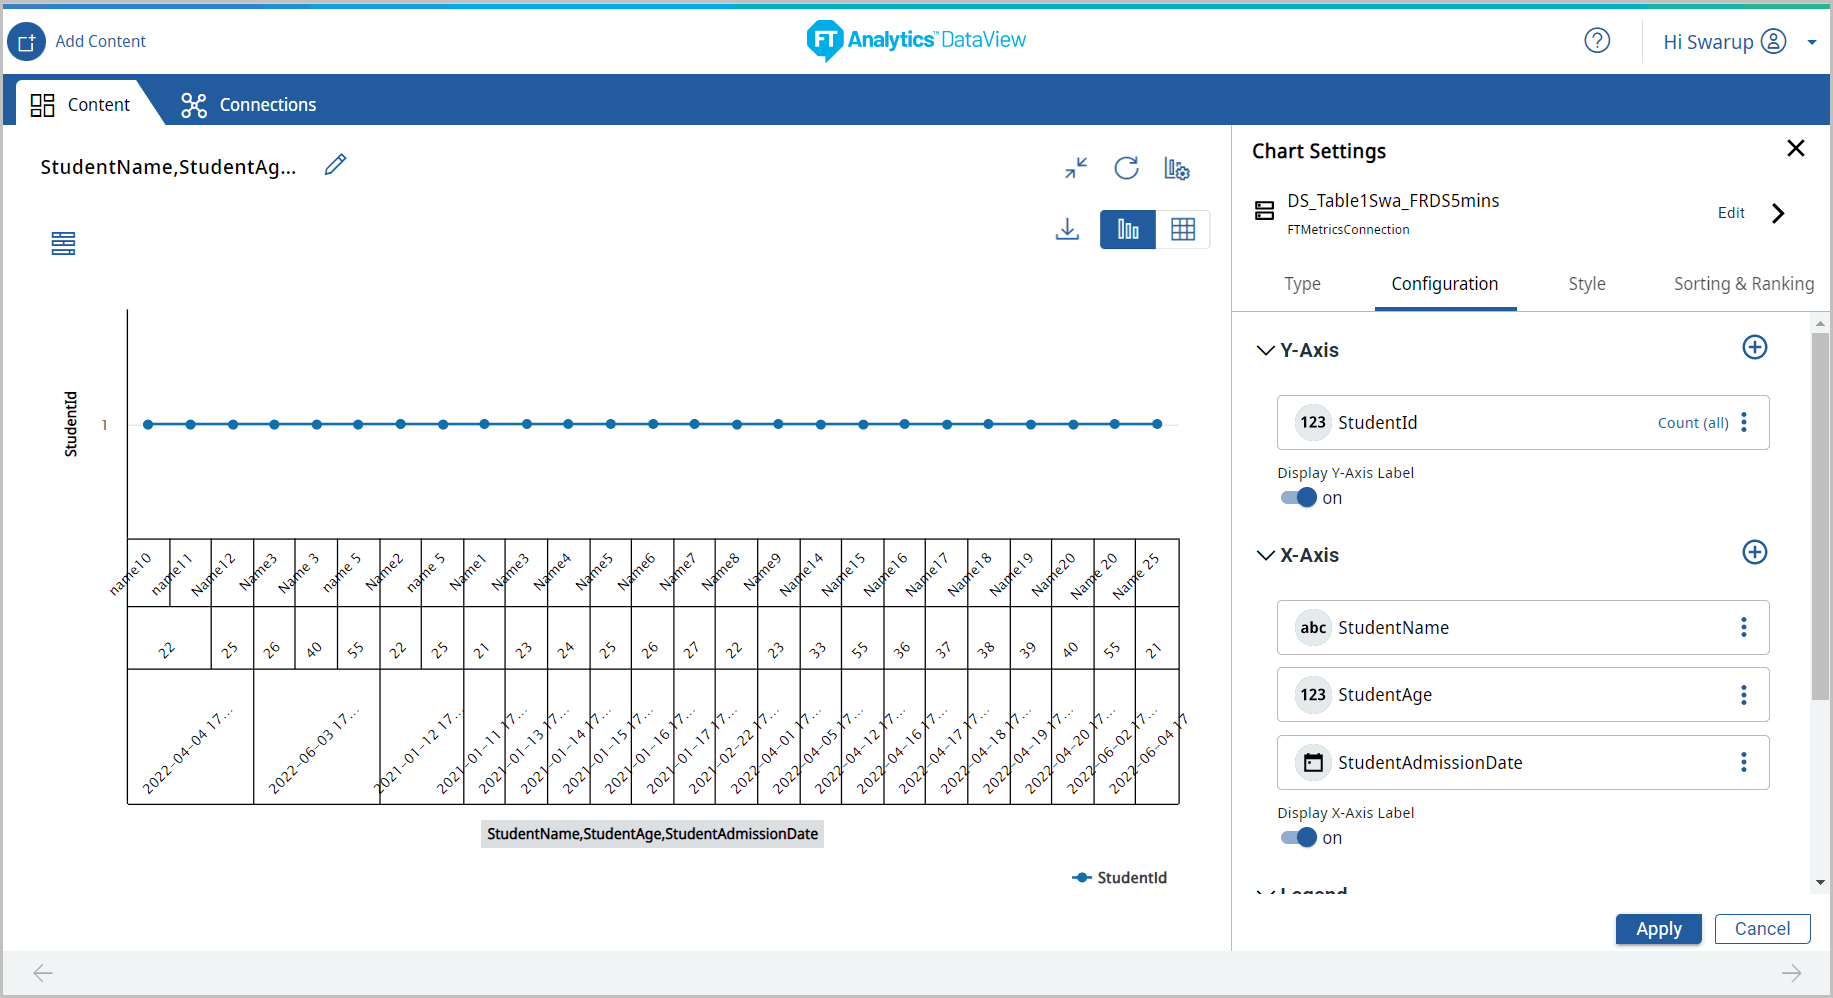 TIP:The Y-Axis values overlap when the user applies Stack for a chart with multiple Y-Axis columns.The updated chart displays.Stack Line Chart Updated
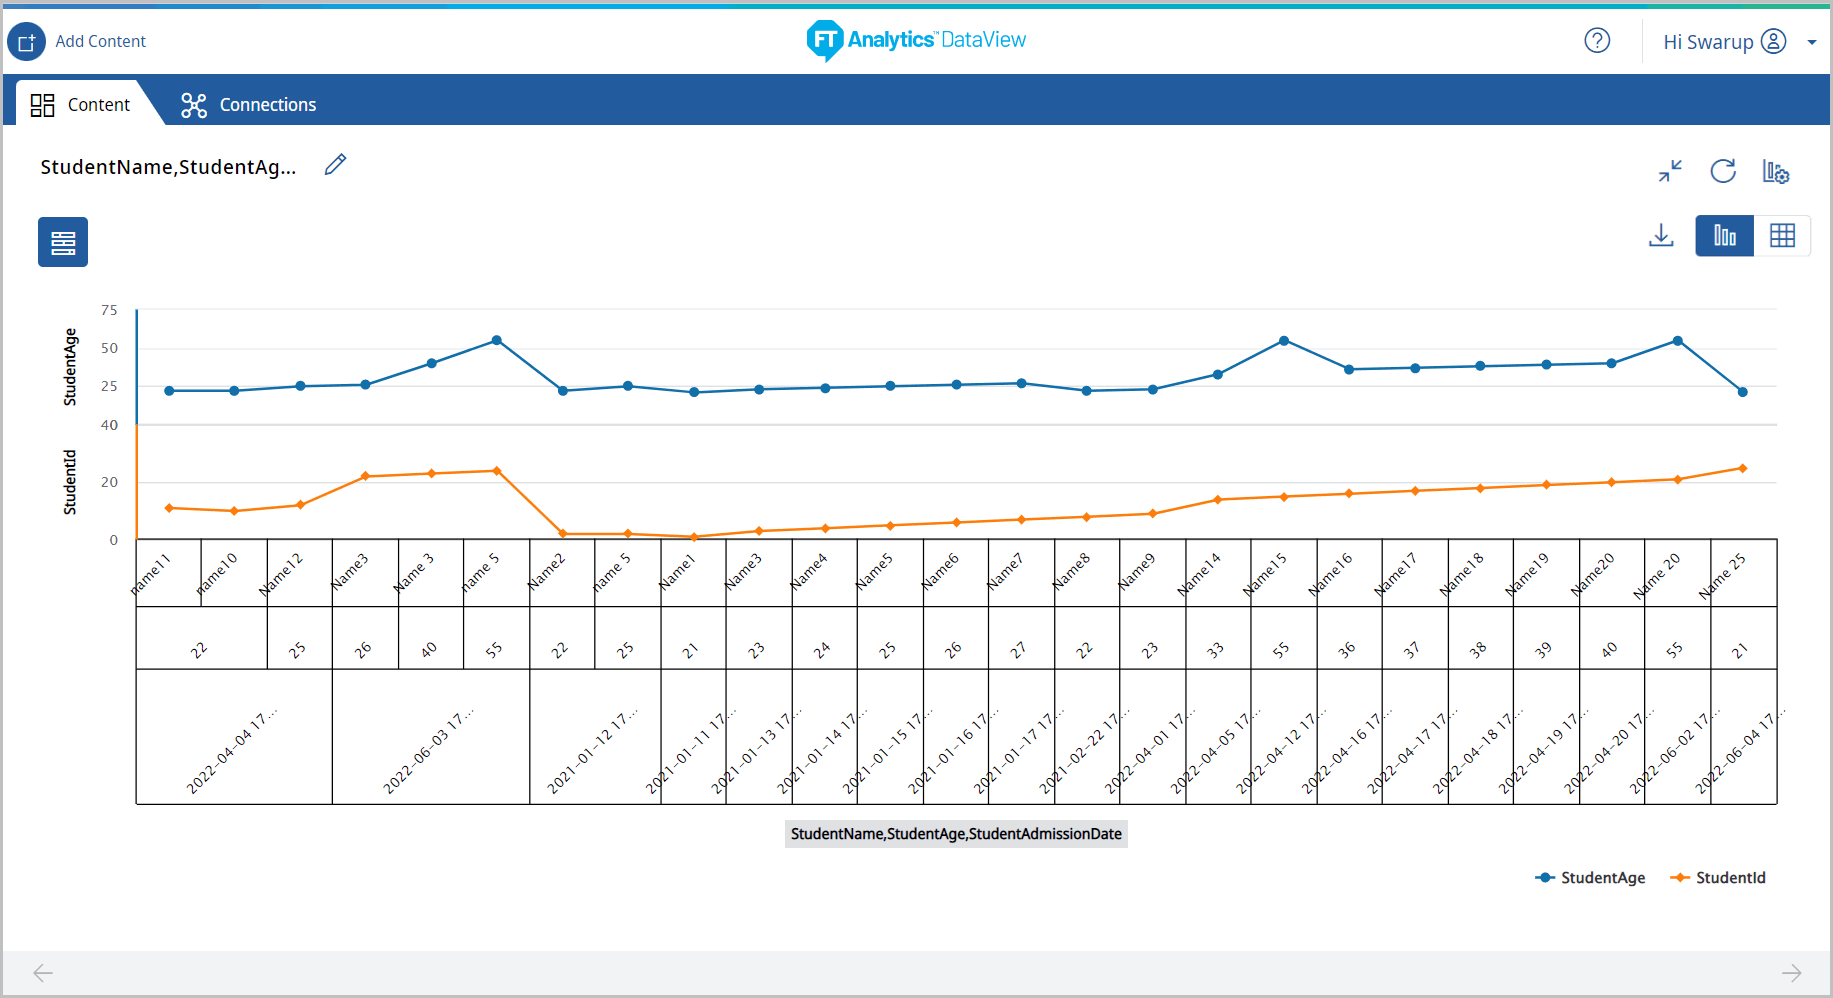
- To turn off Stack, open a Line Chart and click the [] icon.NOTE:By default, the stack function is off.
Provide Feedback