Semi Circle Gauge Chart
- Open a Storyboard, hover the mouse on a chart tile and click the [
 ] icon to maximize the tile.
 - Click the [
 ] icon. The Chart Settings window displays.Chart Settings
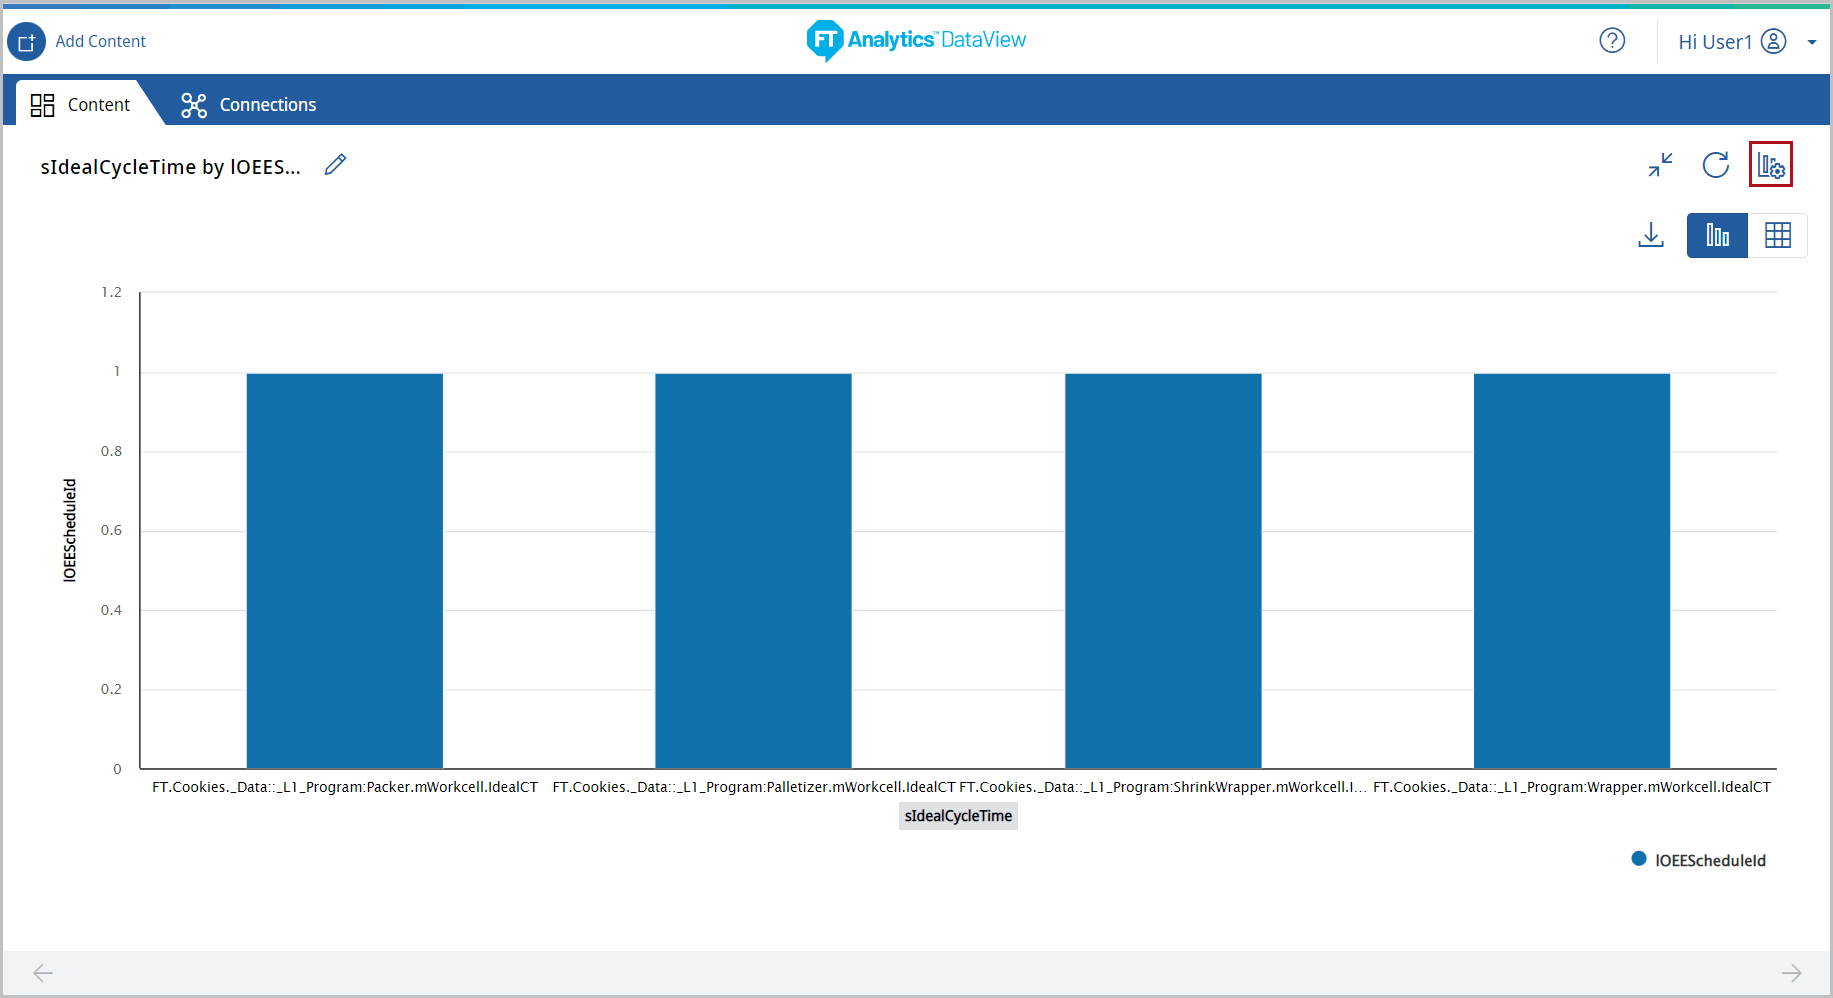 Under the Type tab, the list of available chart type displays.
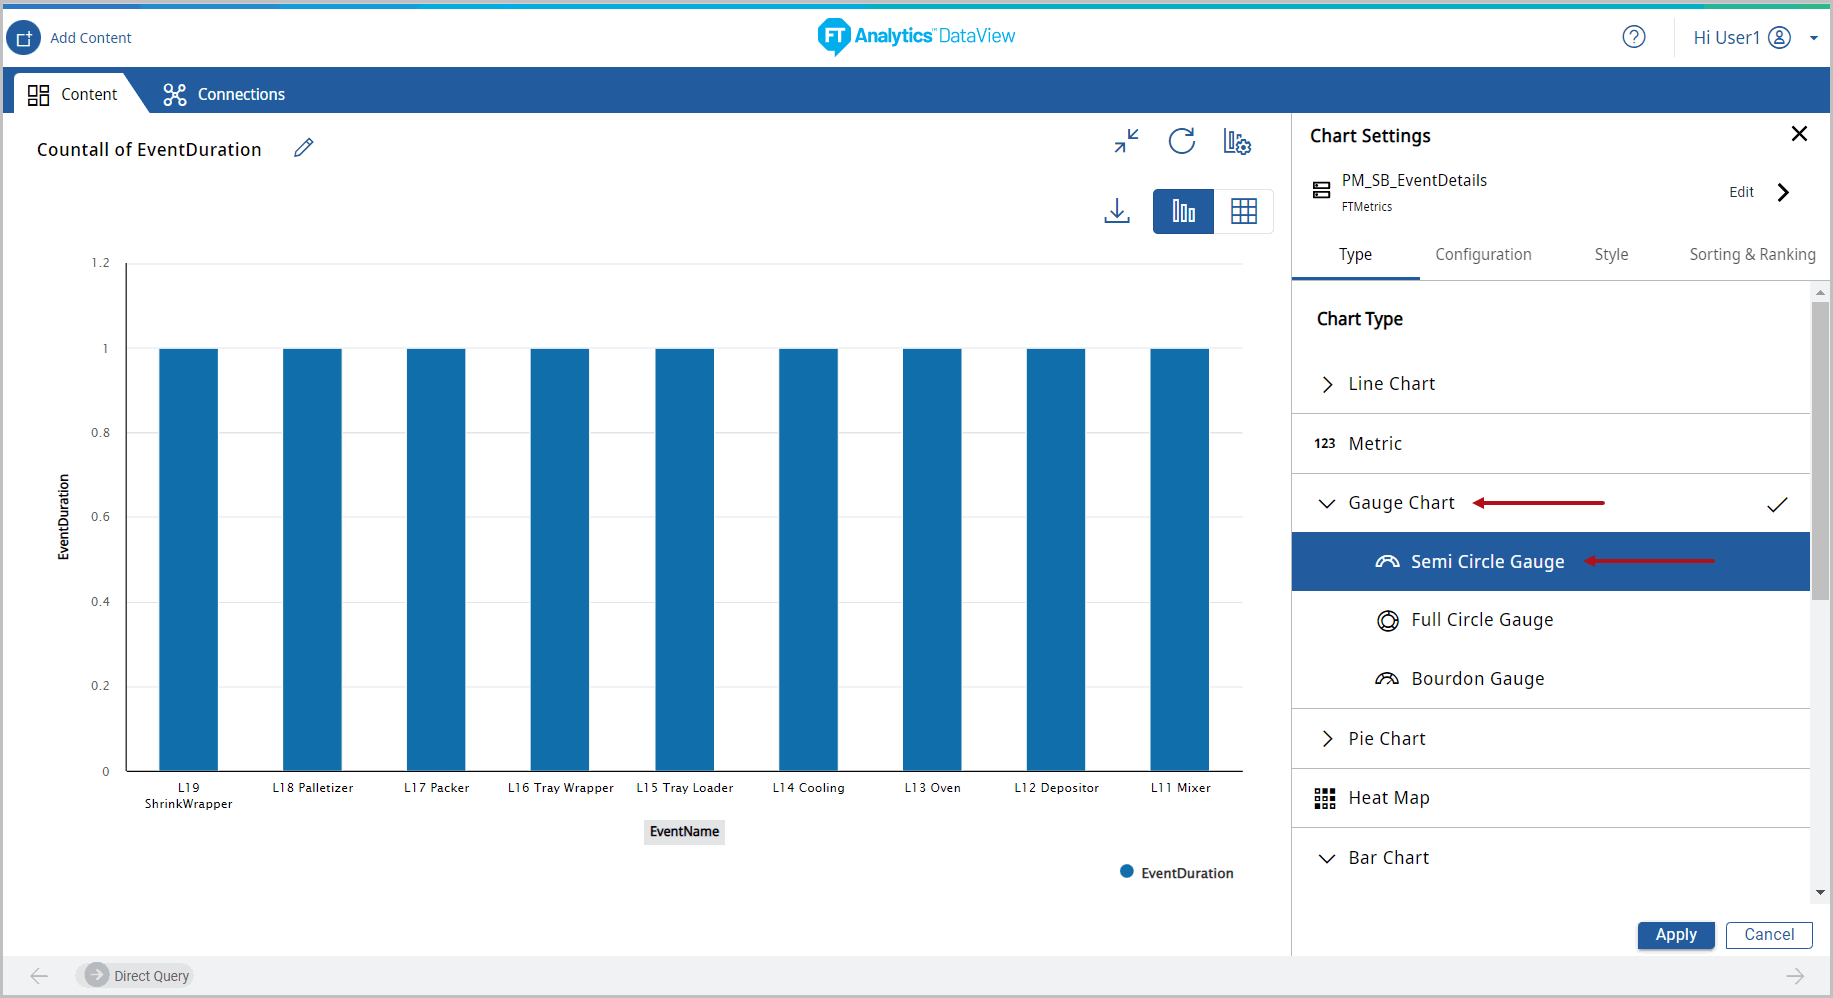
 - Click [Gauge Chart]. The available chart models display.
- Select the [Semi Circle Gauge] chart from the Gauge Chart section.Chart Settings
- Under the Configuration tab, define the following properties:
- Y-Axis: Select the desired data on Y-Axis.
- Date Field: Select the desired Date field on X-Axis.
- COMPARE: Select the desired Compare option from the drop-down list. By default, “All” option is selected.
- All
- Weekly
- Daily
- Monthly
- Quarterly
- Half-Yearly
- Yearly
NOTE:The Date Field must be added to select Compare option.NOTE:An error message displays if the Min & Max values are not selected for the chart.Chart Settings -Compare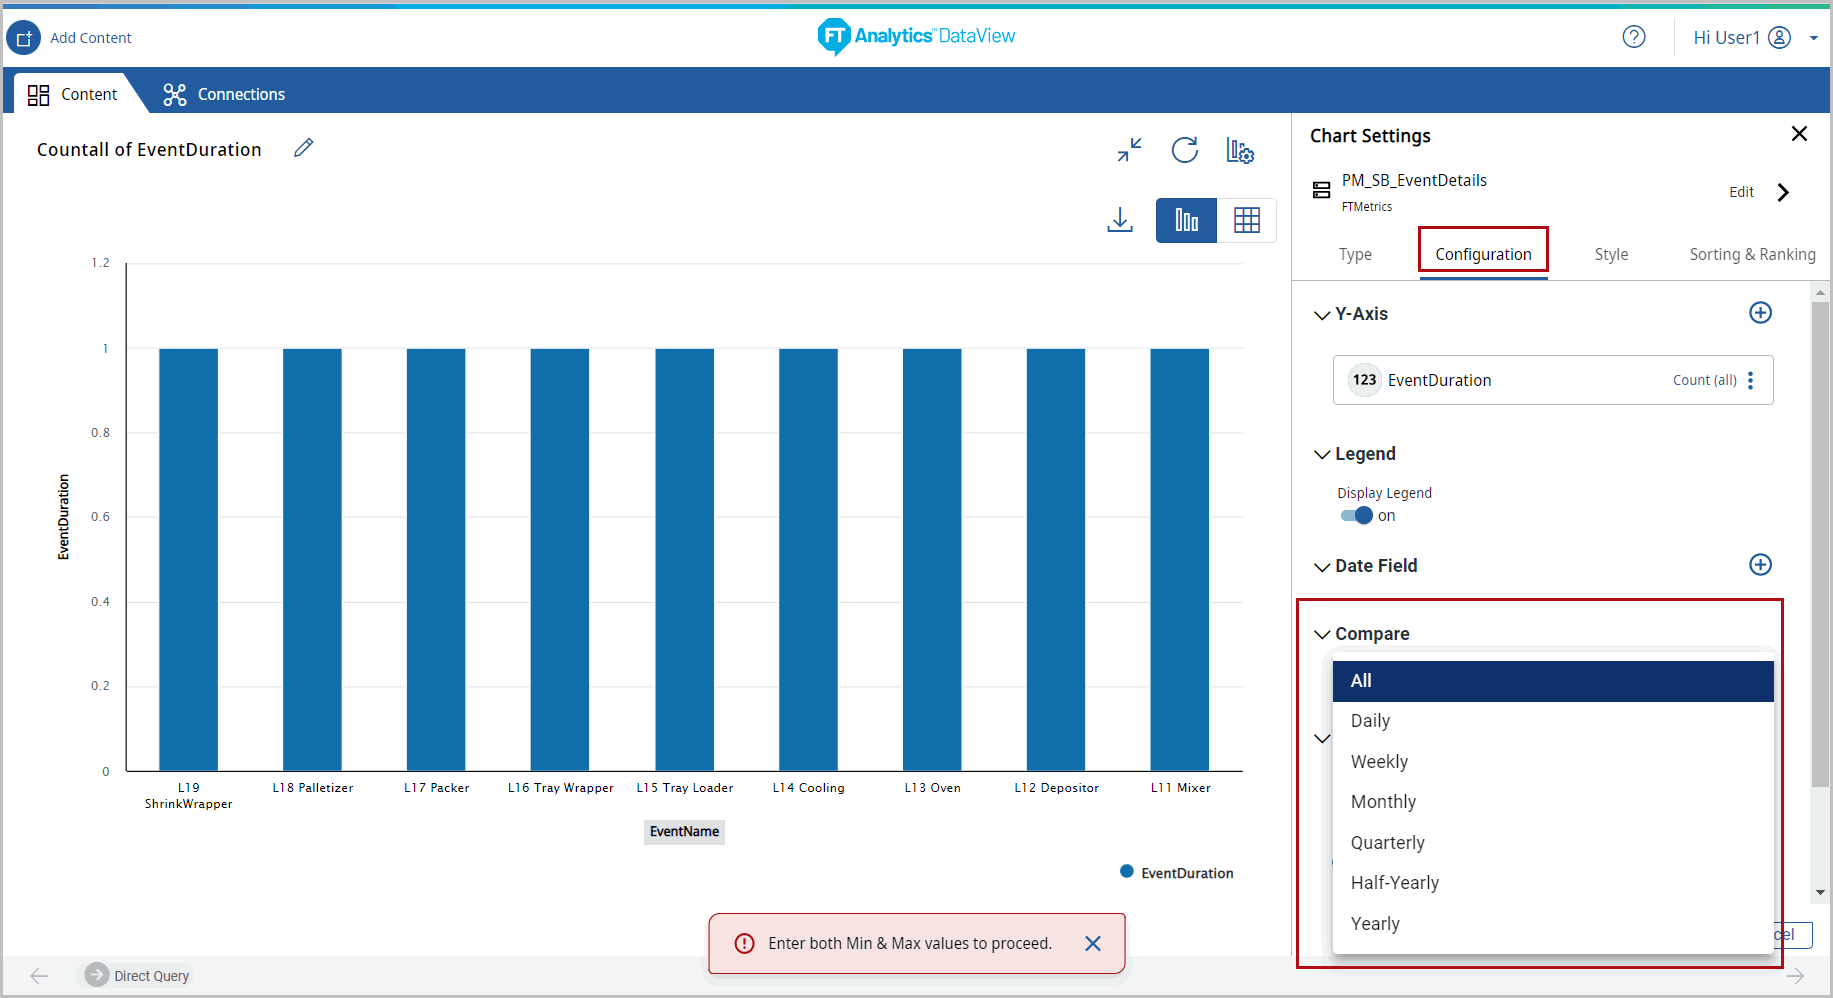
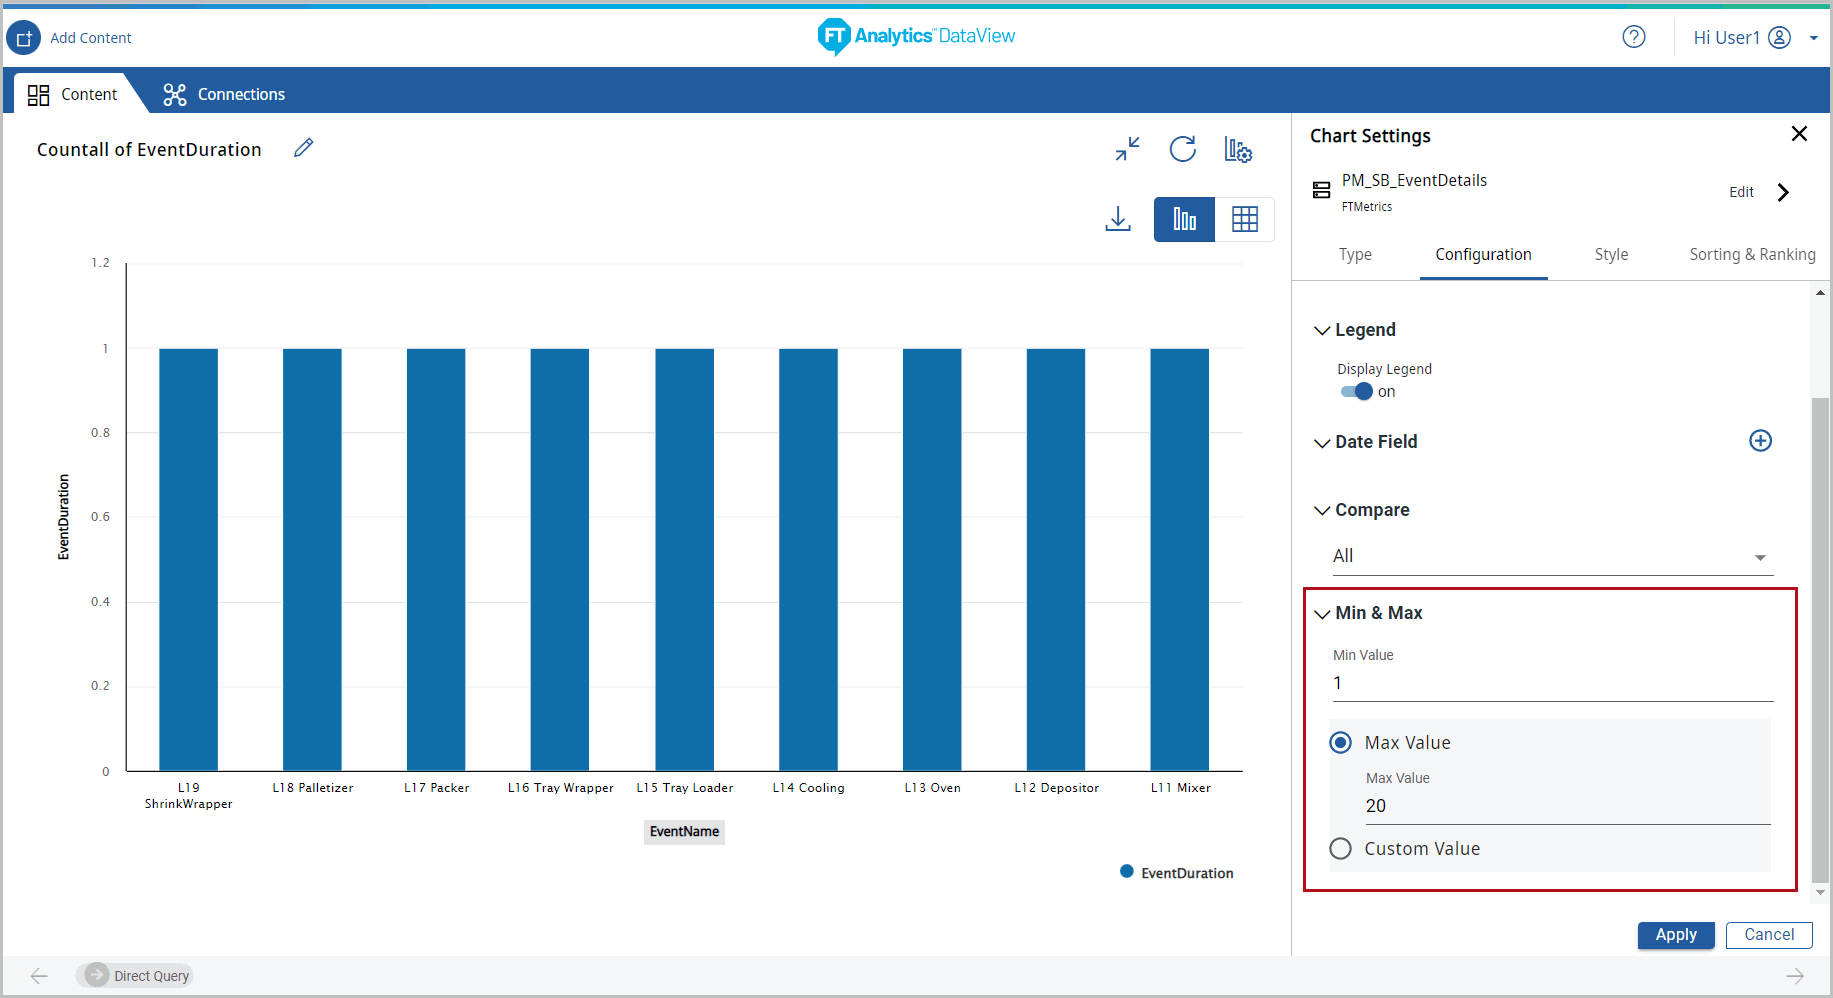
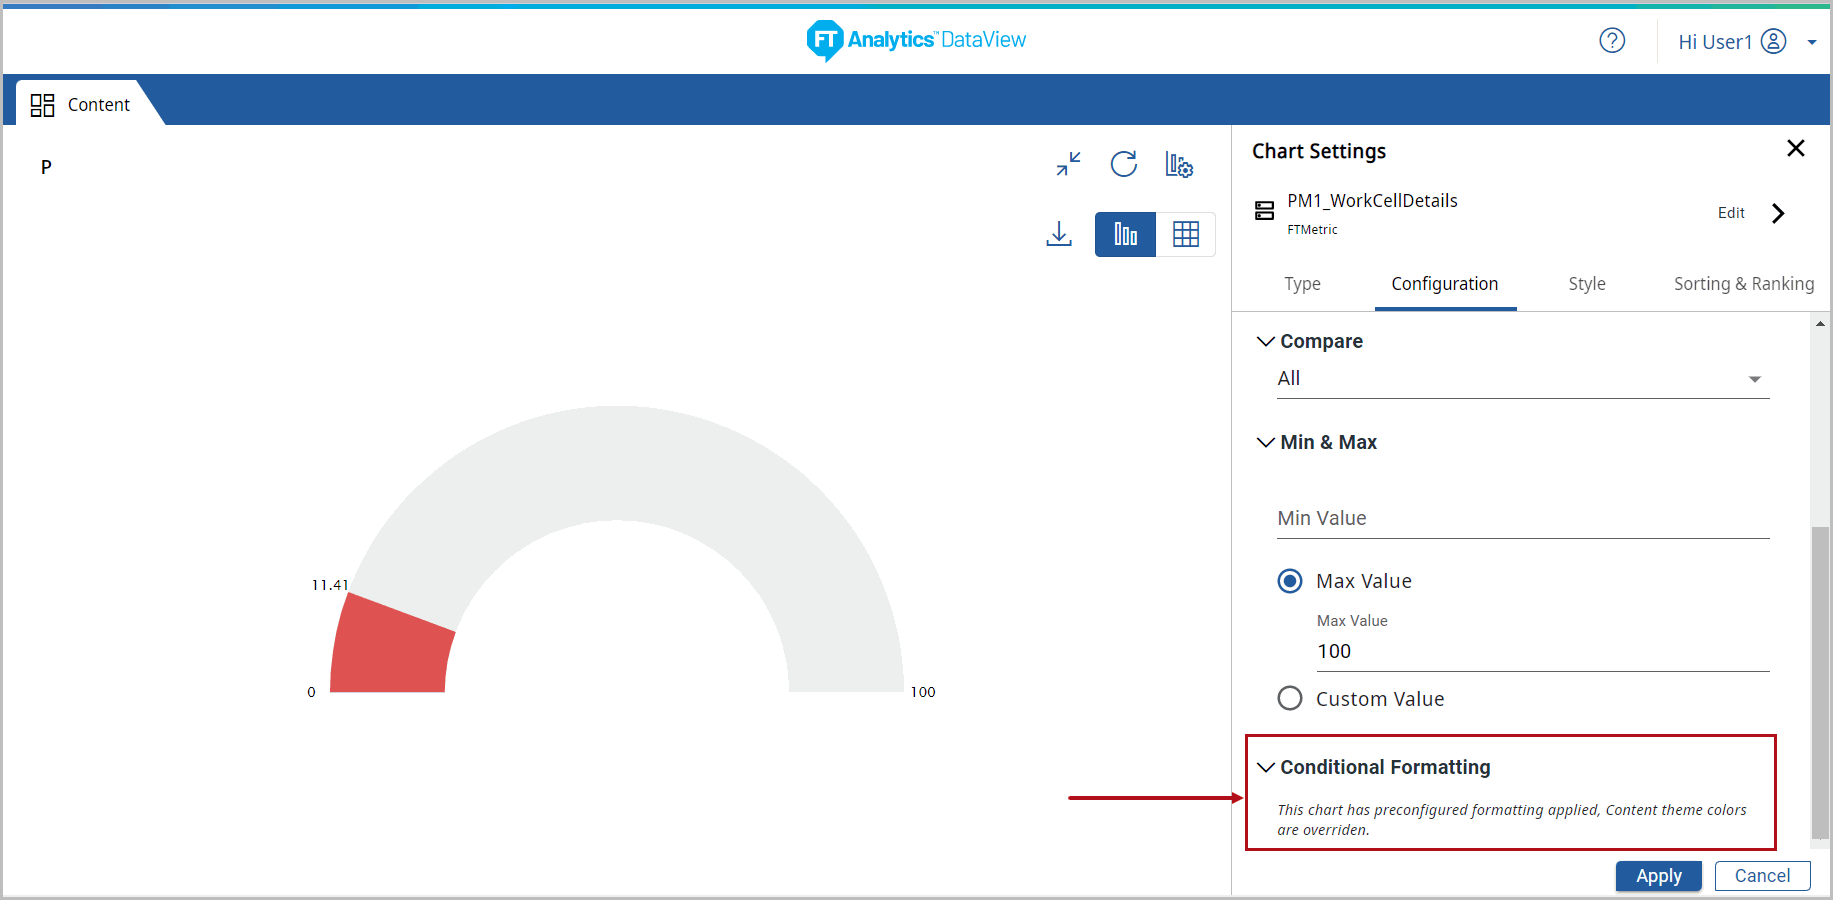
- MIN and MAX: User can define the Minimum and Maximum gauge values. Minimum value must not be greater than Maximum value.(OR)MIN and Custom Value: User can define the Minimum and Custom values. User can select the aggregations on the Y-Axis to create the Custom value. This Custom Value overrides the Maximum Value.
- MAJORTICK Interval: Define the Major tick interval.
- MINORTICK Interval: Define the Minor tick interval.NOTE:If the values are not mentioned then it will take the default values. If the input boxes are empty, then Major tick Interval will be 1/10th of the max value of the chart and Minor tick Interval will be 1/5th value of Major tick Interval value.Chart Settings - Minimum Value
- Conditional Formatting: For Storyboards created with pre-configured templates a “This chart has preconfigured formatting applied, Content theme colors are overridden.” message displays.Chart Settings - Conditional Formatting
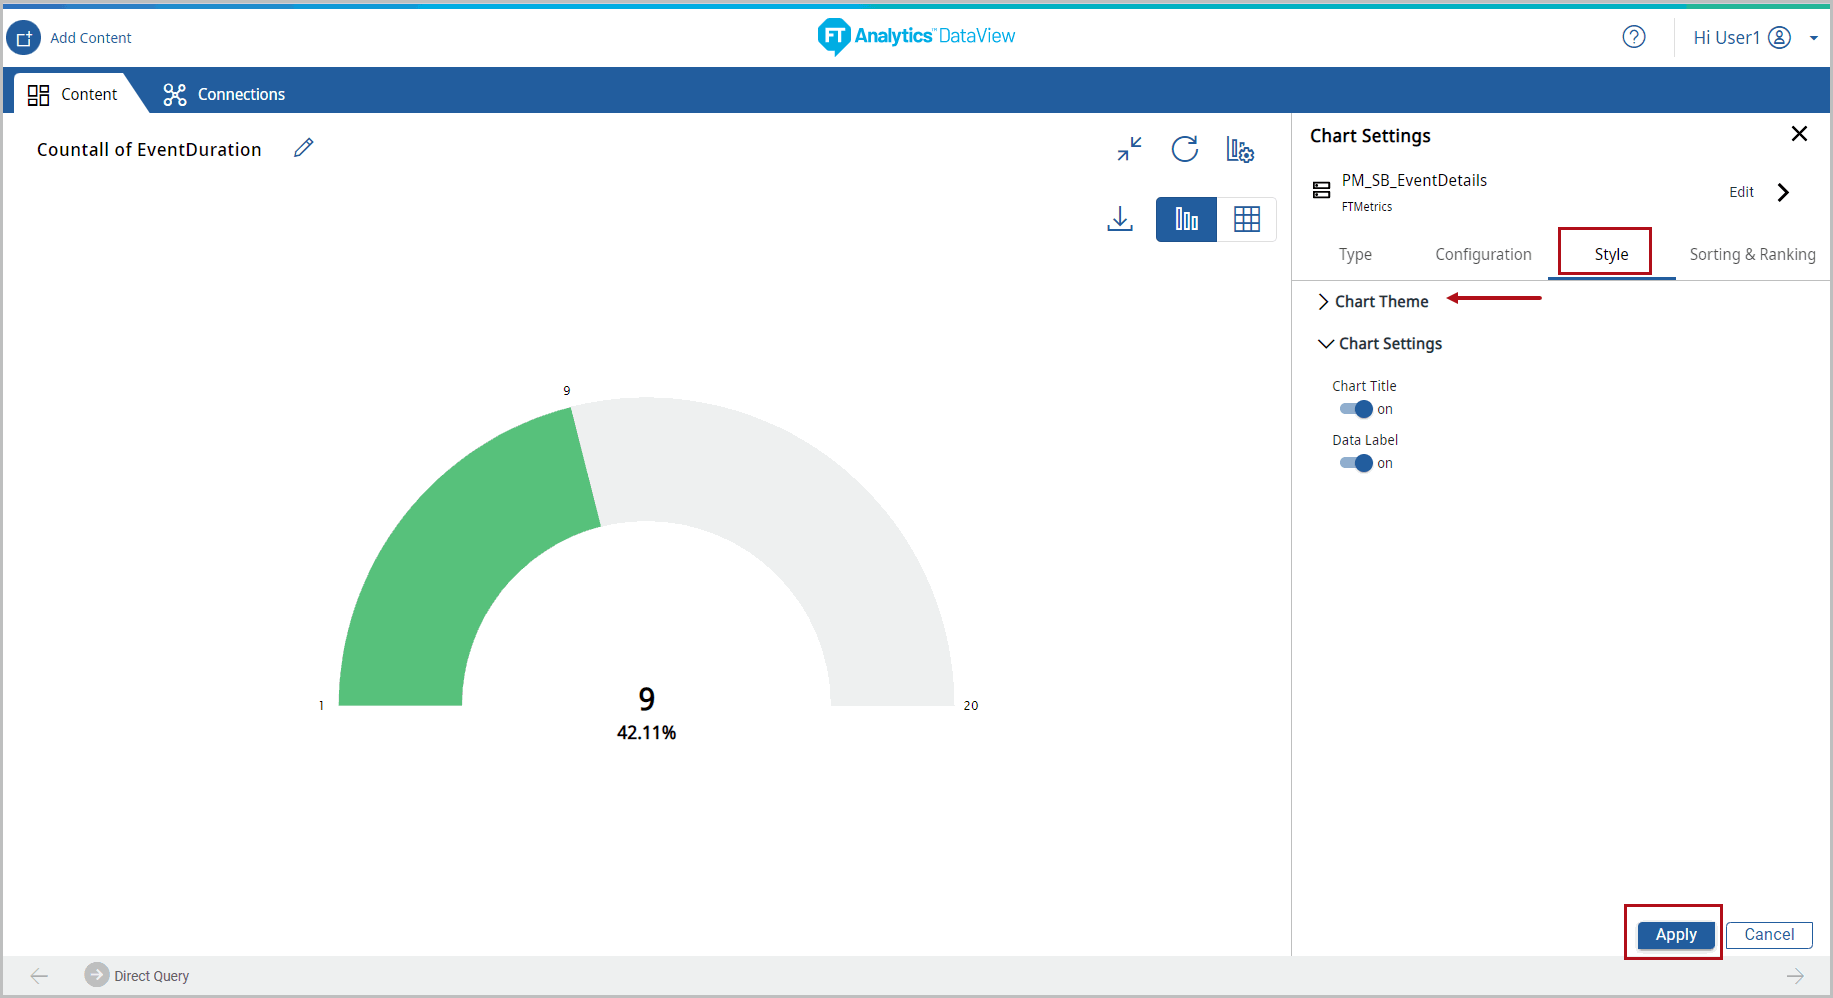
- Under the Style tab, User can change the following:NOTE:For Storyboards created with pre-configured templates (for example: Plant Manager or Alarms & Events template) has pre-configured formatting applied, Content theme colors are overridden.
- Chart Theme: Change the theme color.
- Chart Settings: User can enable or disable the following options:
- Chart Title
- Data LabelChart Settings - Style
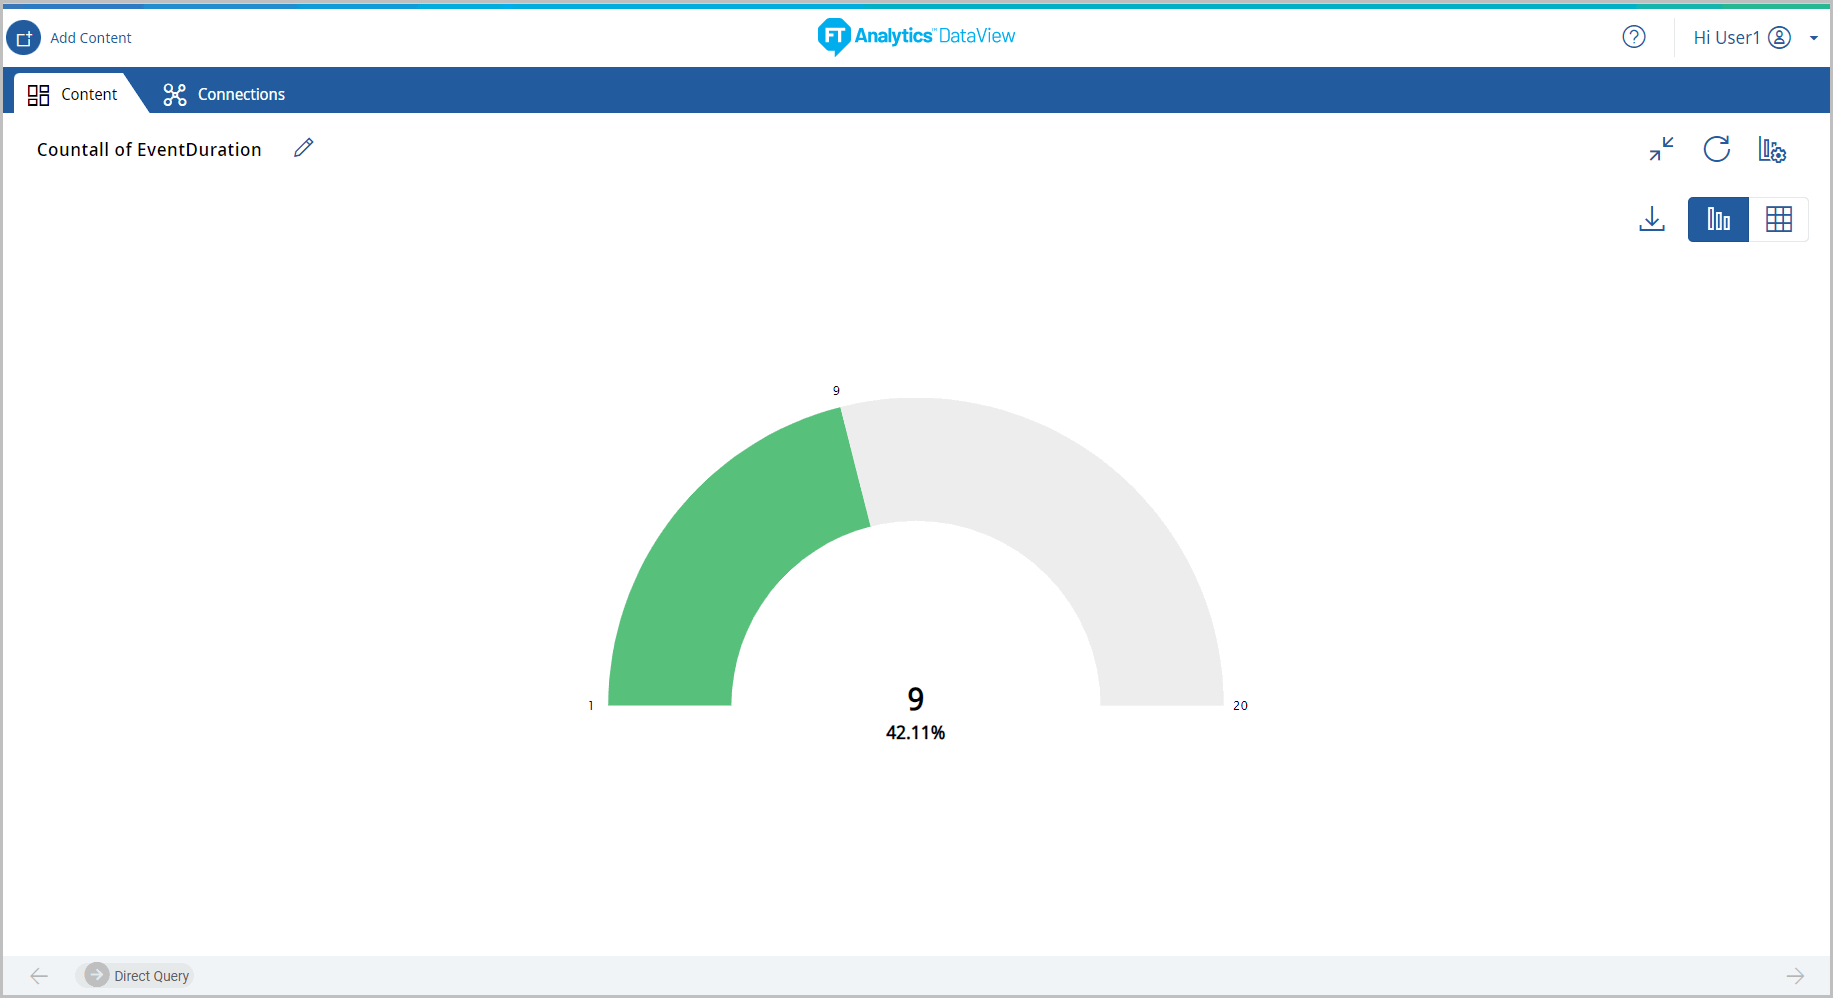
- Click [Apply]. The Semi Circle Gauge chart displays.Semi Circle Gauge Chart
- Click [
 ] icon to minimize the chart. The updated Storyboard displays.Storyboard Updated
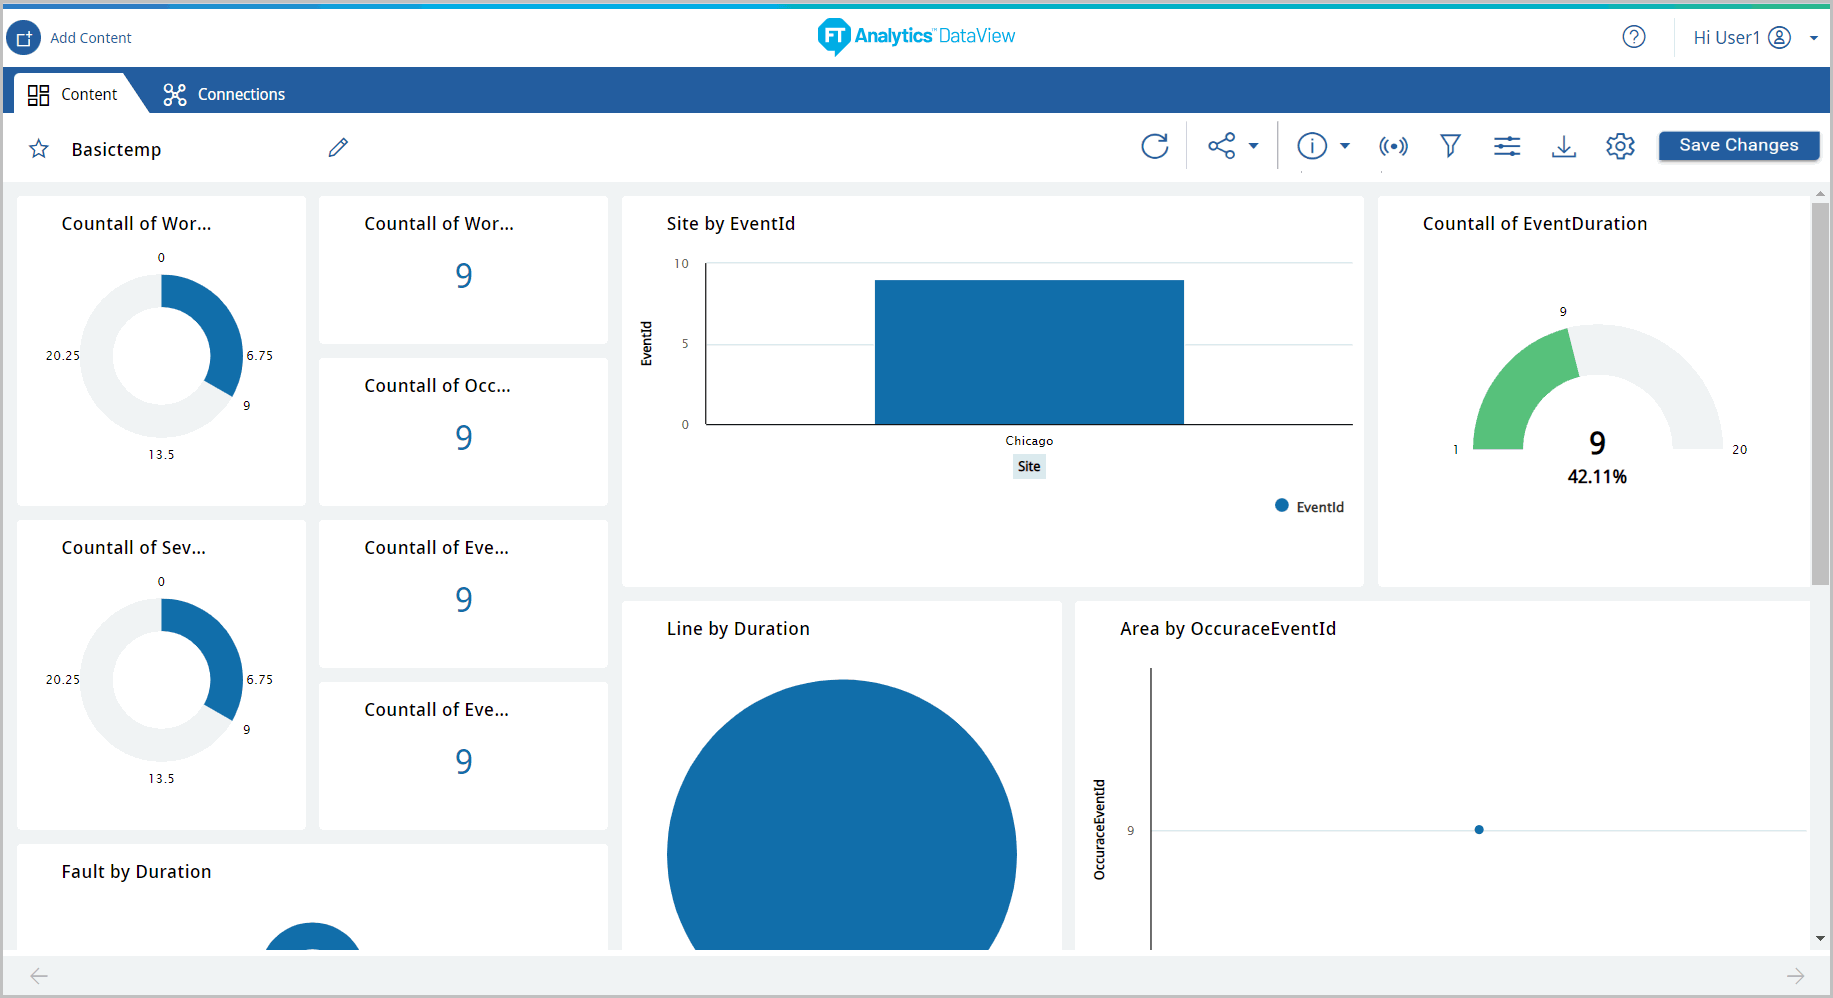
Provide Feedback