Search
FactoryTalk Optix Help
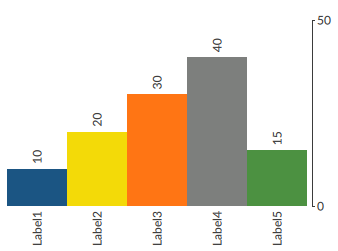
Histogram chart
Display data in the form of a bar diagram.
Example
Data controls
Configure a Histogram chart
Provide Feedback
Have questions or feedback about this documentation? Please
submit your feedback here
.