Search
FactoryTalk Optix Help
Sparkline
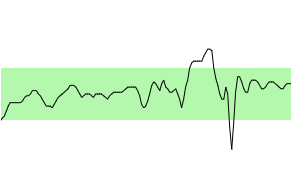
Use sparklines to display how values change over time on simple charts with one pen only. Display data from a database or sample data in real time.
Sparkline example
Data controls
Configure a sparkline
Provide Feedback
Have questions or feedback about this documentation? Please
submit your feedback here
.