- Getting started
- Creating projects
- OPC UA
- Graphic objects
- Predefined graphic objects
- Object and variable references
- Extending projects
- NetLogic
- Tutorials
- Dynamic links tutorial
- Graphic objects tutorial
- NetLogic tutorial
- OPC UA tutorial
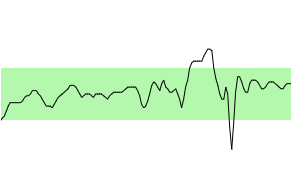
Sparkline
Use sparklines to display how values change over time on simple charts with one pen only. Display data from a database or sample data in real time.
Sparkline example
Provide Feedback