Advisory Alerts
An Advisory is generated when a failure is expected to occur within a certain time period, typically this is within 21 days. The Advisory contains information about the potential failure, including the diagnostic and recommendation on how to validate and address the detected potential failure. Additional data is provided for context, a Snapshot tab to show you the current state of all the variables when the advisory was generated, and a Trend tab to allow you to analyze the advisory in more detail as required.
Advisories are generated on Asset Components. There are three different tabs available in the advisory alerts:
- Overview
- Trends
- Snapshot
Advisory Overview

Overview
TabIn the
Overview
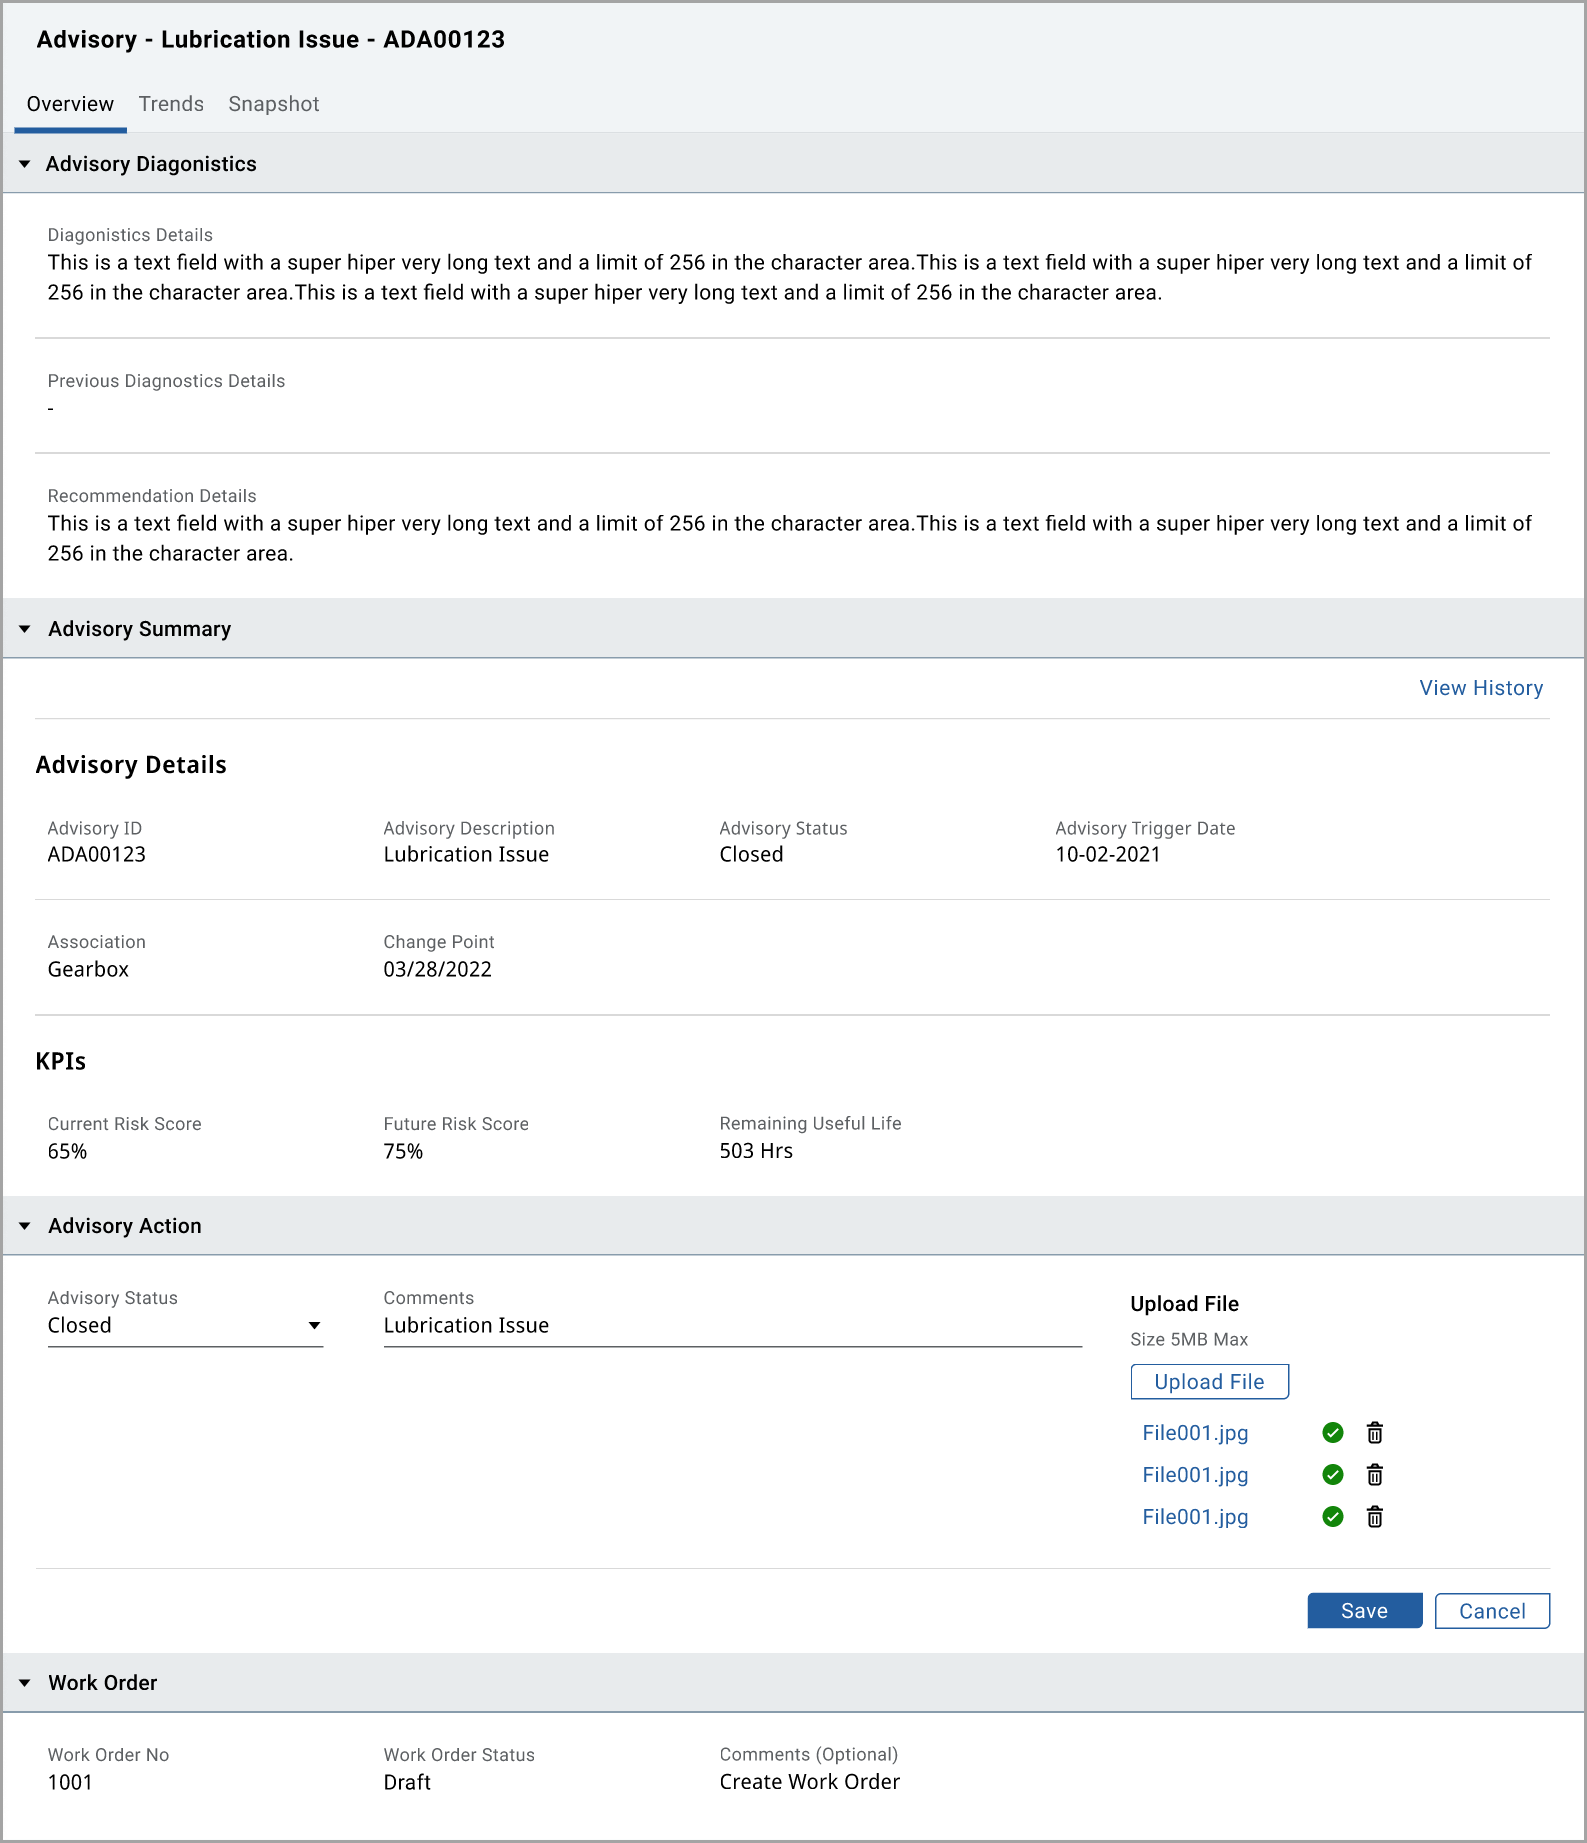
tab, there are four different sections: Advisory Diagnostics, Advisory Summary, Advisory Action, and Work Order. The
Advisory Diagnostics
provides information about the potential failure, including the diagnostic and recommendation on how to validate and address the detected potential failure. If previous Diagnostics were provided on this Component, they would be shown in the Previous Diagnostic Details SectionThe Advisory Details contain details as indicated in the image below, with supporting KPIs at the time the Advisory was generated.
In the
Advisory Action
section, with appropriate user privileges, you have the ability to change the status of the Status, Add Comments, and Upload associated filesFor
Advisory Status,
here is the definition of each status:- Open
- In-Progress
- Closed
In the
Work Order
section, it allows for the manual tracking of the associated Work Order required for action the alert.- Work Order No: Provide the work order number for the alert.
- Work Order Status: Select the status from the drop-down list.
- Comments: (Optional) Provide the comments for the alert as required.
NOTE:
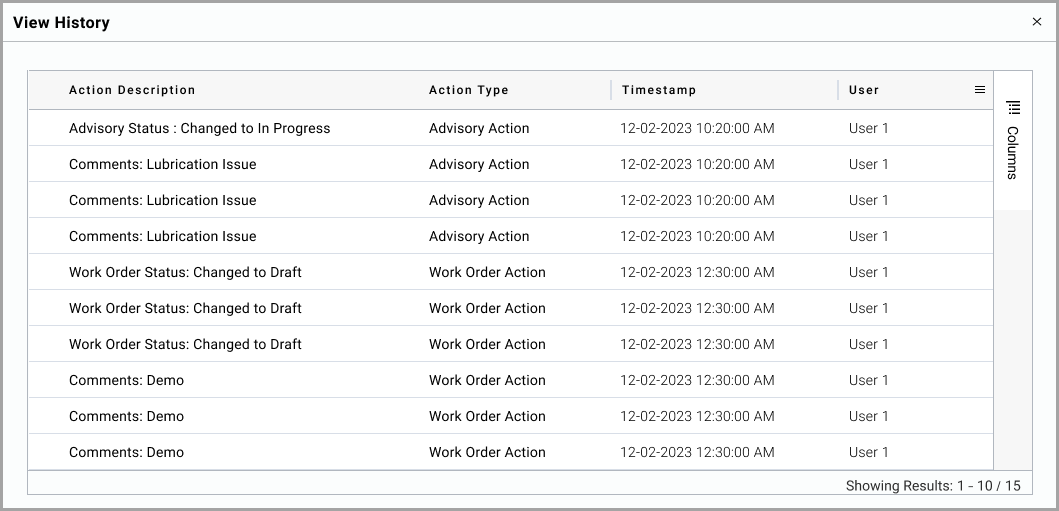
To view the history of changes that happened in the Sensor Fault Action and Work Order section, click [View History].
View History

Trends
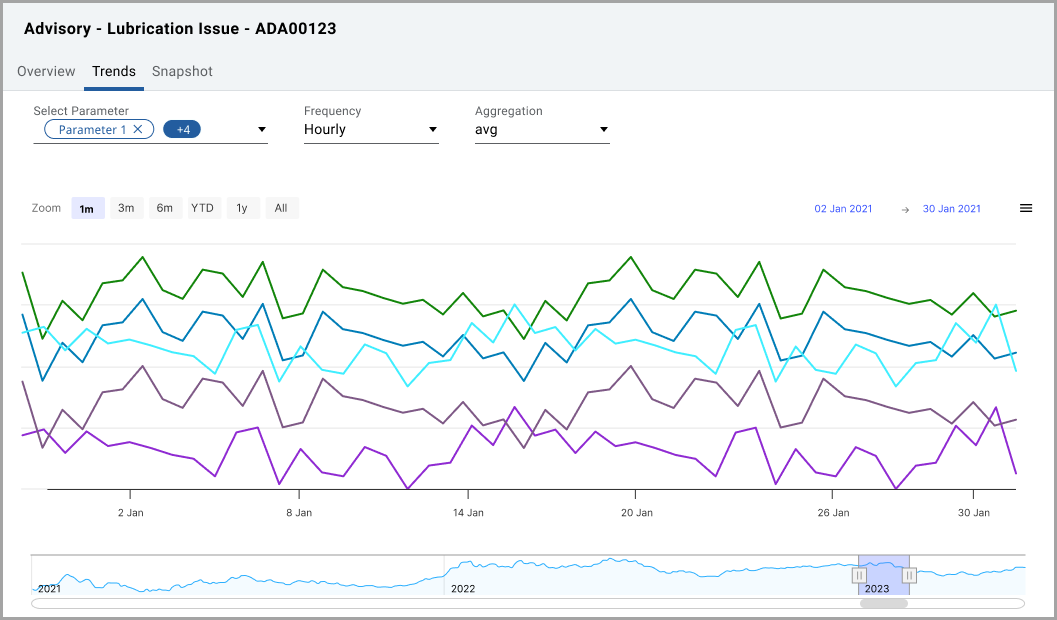
TabIn the Trend Tab, you can view all associated parameters to the Component to do further analysis. You have selections of how to view this data. You can select parameters, aggregation methods, and time periods to analyze further.
Advisory Trend Tab

In the Trend, you can view both the Trend at the top and a sparkline view at the bottom. You can change the date selection by using the selectors of 1/3/6 months, year to date [YTD], 1 year, and all. You can use the sliding selector at the bottom to change the date selection.
The vertical dotted line shows today's value, the trend after today indicates the forecast KPI, and the trend before today shows the historical data.
The Vertical grey bars indicate thresholds exceeded areas.
NOTE:
Click on any parameter line from the chart to view the respective threshold limits.
Snapshot
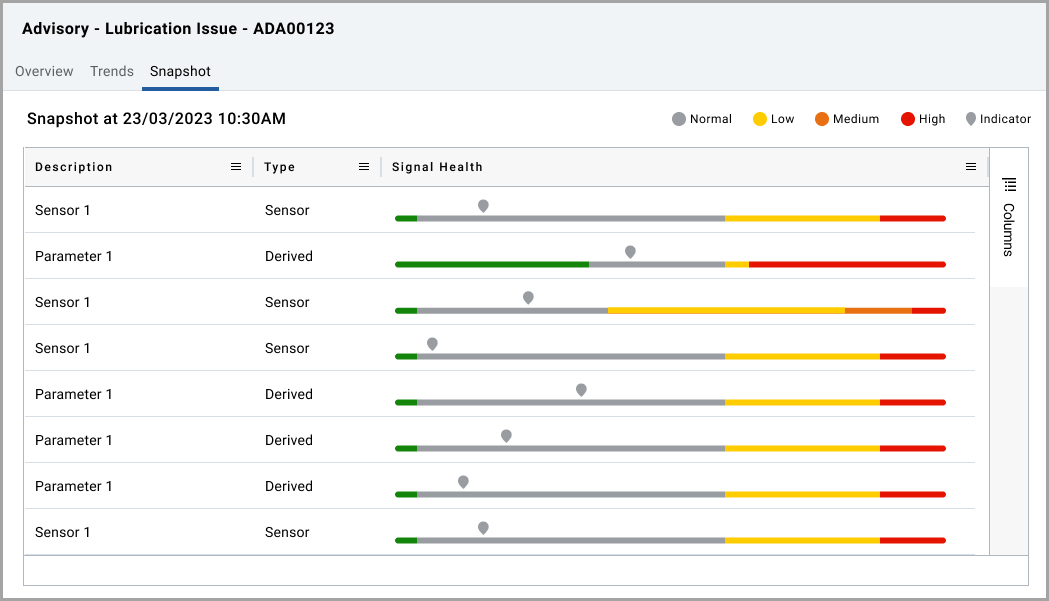
TabThe snapshot shows the condition of each sensor relative to the Advisory Threshold Limits at the time of the triggered Advisory.
There are two different types of Sensors Physical and Virtual as defined during the Asset Setup. The timestamp is provided as a starting point for additional investigations.
Advisory Snapshot Tab

Provide Feedback
