Create InFluxDB Dataset
Perform the following steps to create an InfluxDB Dataset:
- Navigate to the Connections tab and select the folder where the FT Service connection is added.
- Click the [
 ] icon and click [Add Dataset].
 - The Add Dataset page displays. Provide the following details:
- Dataset Name: Provide a unique Dataset name.NOTE:If the Dataset with the provided name already exists, an error message displays and also maintains XSS validation.
- Connection Name: Displays the selected Connection Name.
- Direct Query: Toggle the Direct Query option using the slider to enable Direct Query. Refer to Appendix A, “Supported Features - Direct Query and Non-Direct Query” for further details.
- Direct Query is a mechanism to fetch the updated data directly from the data source (i.e. connector).
- When Direct Query feature is enabled, the Storyboard data will not be stored in Elasticsearch.
- Select the desired InfluxDB tags from any one of the following options:
- Custom Query: Select the InfluxDB server the Custom Queries option displays.
- Select [Custom Queries] and write the Custom Query in the “Write your query below” area.
- Click [Validate]. The “Query validated successfully” message displays.Custom Query
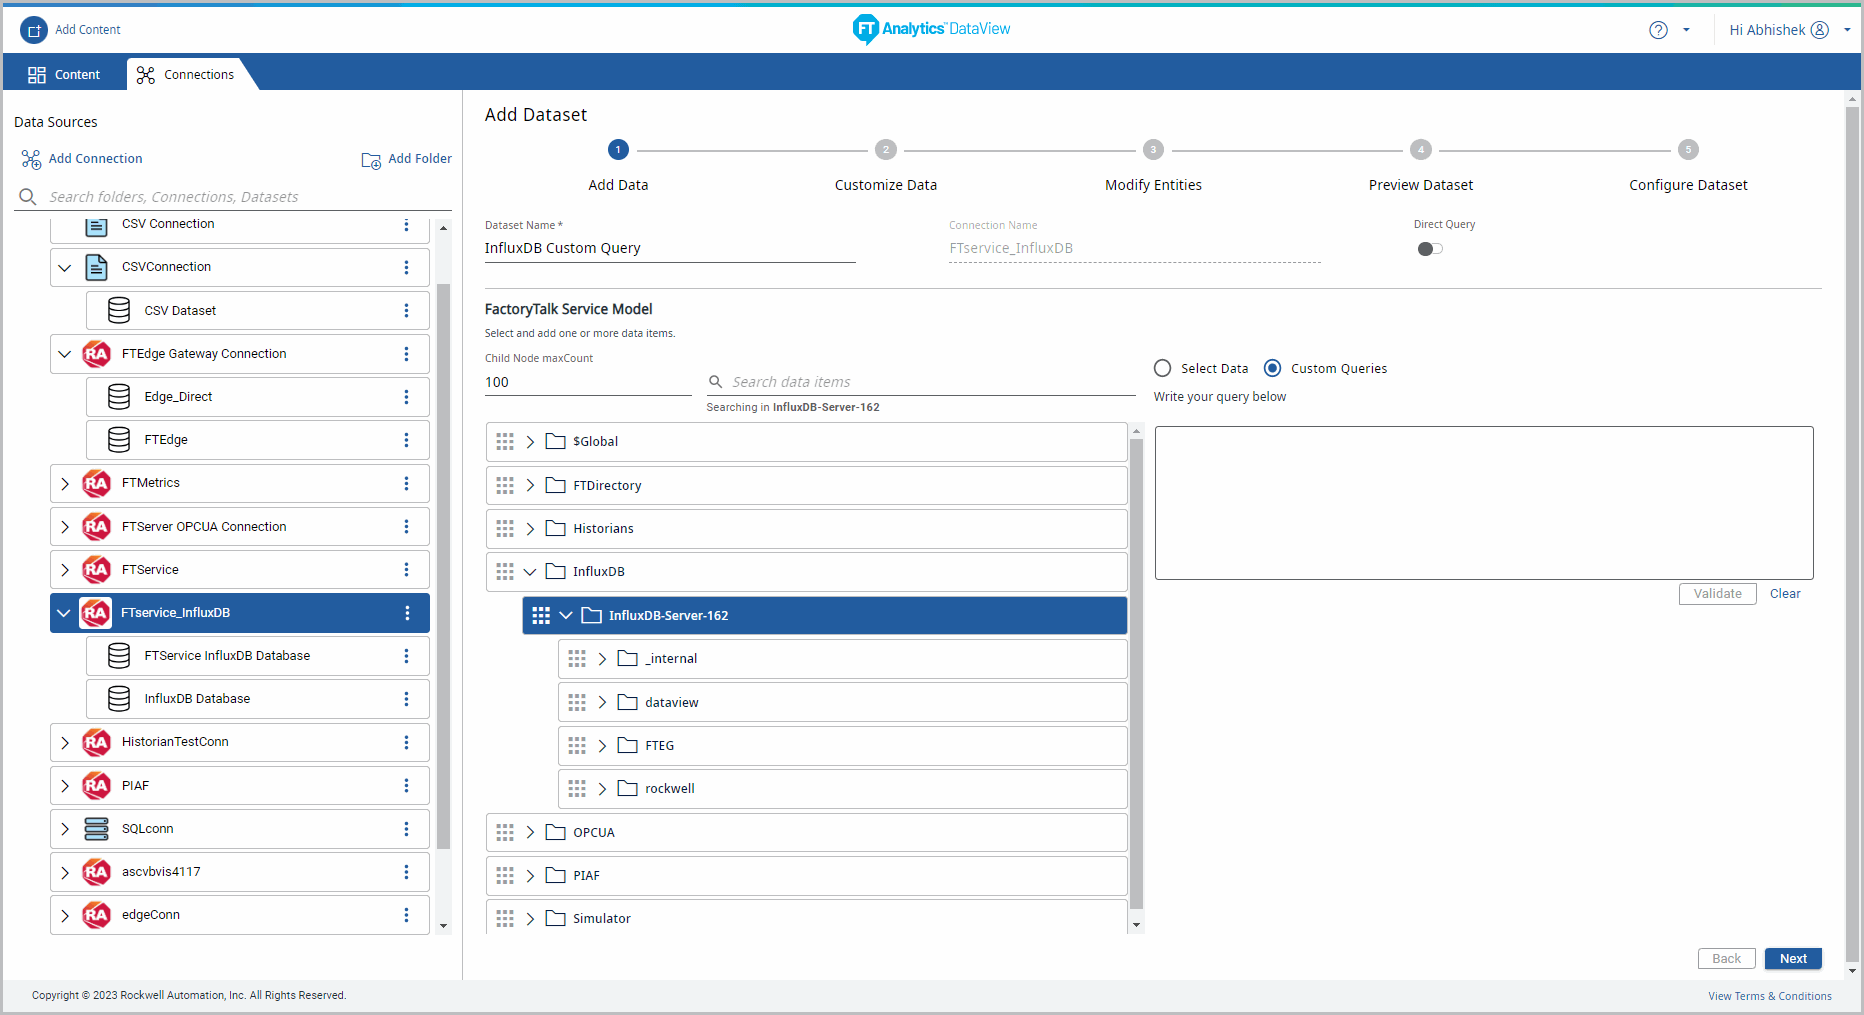
- Select Dataset: Drag and drop the desired tags from the respective service model.
- By default, the Child Node MaxCount is 100. Click on the dataset, and the Search data items option displays only if the dataset has the child node. User can search for the required child node.(OR)
- Click the [
 ] icon to expand and select the child node from the list. NOTE:Hover the mouse on a node in the tree the full node text followed by count of immediate children displays. For example: “<node-text> Children Count: <number>”Add Dataset
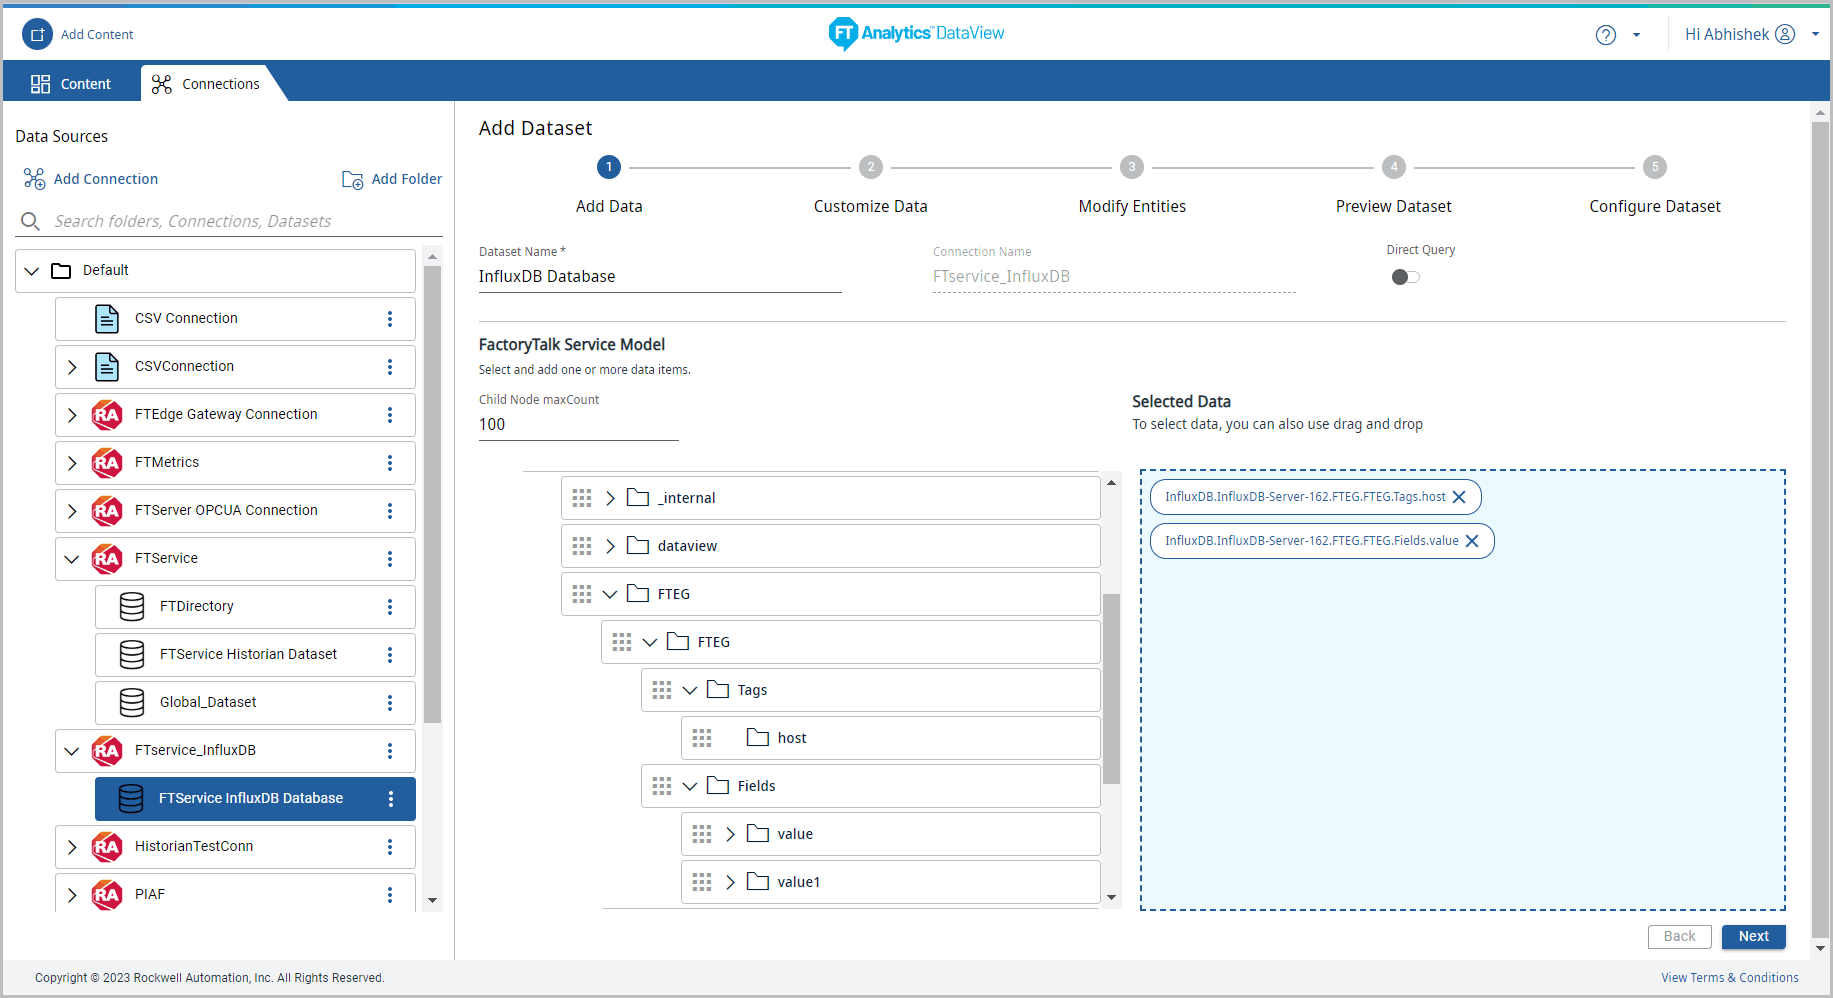
NOTE:The “No Children found” message displays if there are no child nodes available for the data.NOTE:If User selects two tags with same name but from different parent directories then the tag name is displayed with the parent directory hierarchy separated with a ‘.’ (period separator). For example:InfluxDB.InfluxDB-Server.Telegraf.win_disk.Tags.Host and InfluxDB.InfluxDB-Server.Telegraf.win_cpu.Tags.HostNOTE:While creating a dataset with the direct query if the selected string type tag has a Boolean value the “<tag name>:EngineeringUnit is not supported on Y axis:” error message displays.
- Click [Next]. The Customize Data page displays.
- To select the Date Range or Duration under the Date Selection section, define the time series request to generate the data. There are two types of time periods:
- Date Range: Define a specific start and end time period of the request.For Example: for the selected tag, defined the details as follows:
- Start Date: Jan/03/2023
- Start Time: 12:00:00 AM
- End Date: Jan/04/2023
- End Time: 12:00:00 AM
- Duration: Define the time period relative to current time. By default, 8 hours is selected, User can select the duration from the drop-down list.
- Last 15 minutes
- Last 30 minutes
- Last 1 hour
- Last 2 hours
- Last 8 hours (default)
- Last 12 hours
- Last 24 hours
- Last 7 days
- Last 30 days
- In Modify Entities and Preview Dataset sections it displays samples as per the selected parameters.
- Select the Aggregation from the drop-down list.
- Aggregation list displays. Select an aggregation type from the drop-down. List of aggregation types:AverageCumulative TotalCountDeltaDurationBadDurationGoodEndInterpolativeLinearMaximumMaximumActualTimeMaxSampleAndHoldMinimumMinimumActualTimeMinimumSampleAndHoldPercentBadPercentGoodRangeRawSampleAndHoldStandard DeviationStartSumTimeAverageTimeAverageSampleAndHoldTotalTotalSampleAndHoldVarianceWorstQuality
NOTE:Refer to the “Glossary” section for definitions. - Define the number of Sampling interval. User can define any one sample interval type:
- Fixed number of samples: the number of intervals determined by the user.
- Variable number of samples: the number of intervals where the user selects number of sampling intervals every [Seconds, Minutes, Hours and Days] amount of time.
- Select data Quality type from the drop-down list.
- All
- Good
- Uncertain
- Bad
Customize Data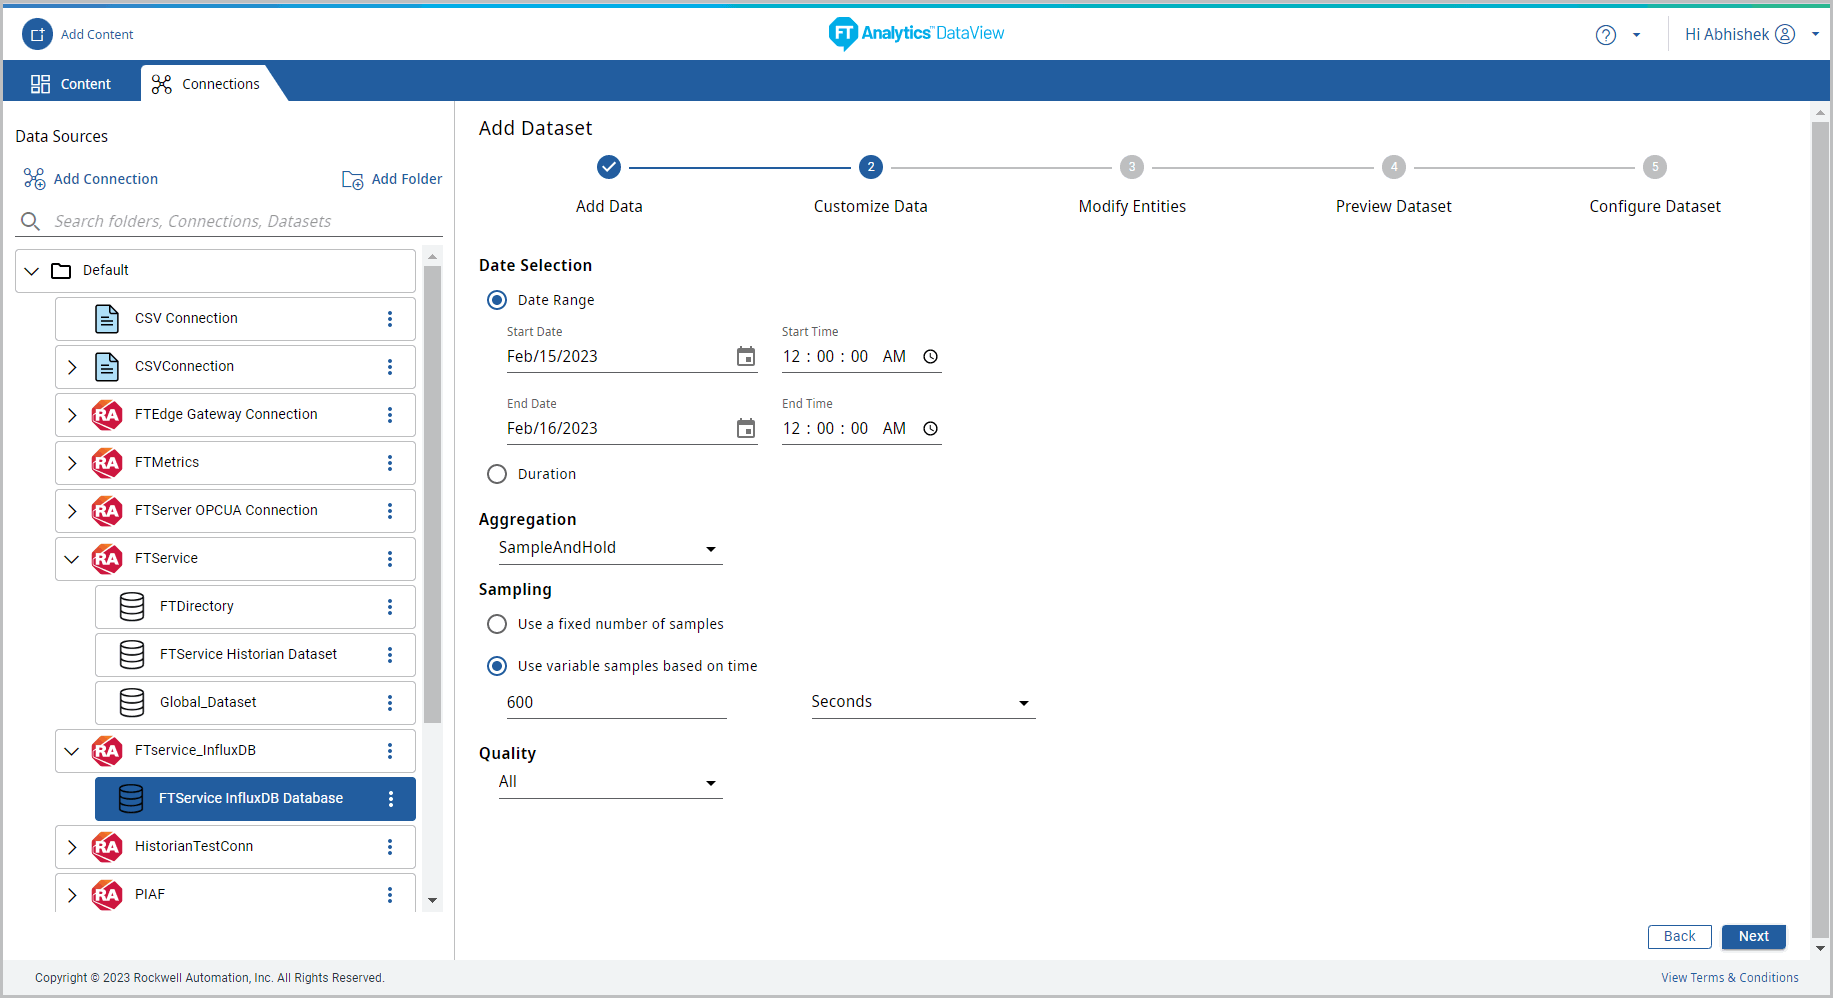
- Click [Next]. The Modify Entities page displays.
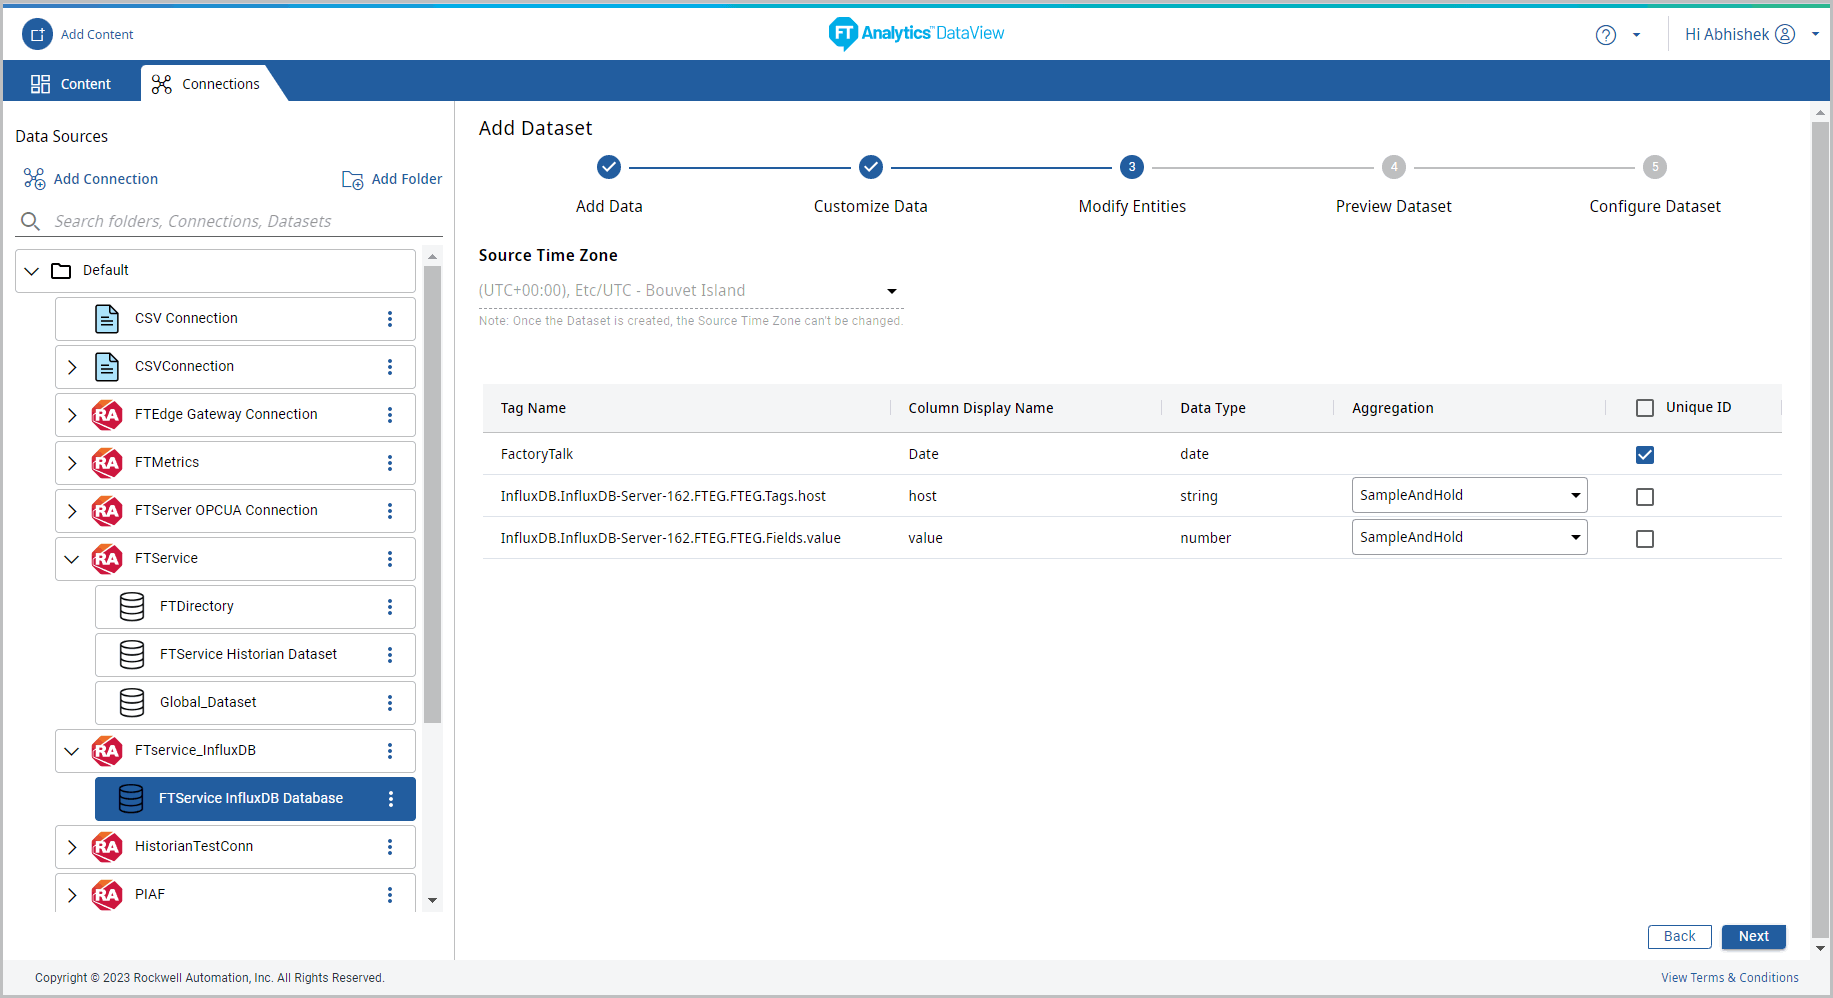
- Select the [Unique_ID] checkbox (by default, the date column is selected) and select the aggregation form the drop-down list.By default, the Source Time Zone is disabled.
- Click the [
 ] icon to clear all the Unique ID columns. Modify Entities
- Click [Next], the Preview Dataset page displays the date.NOTE:Preview dataset page displays maximum 1000 records and columns like, Date, Value, Engineering unit, quality and hierarchy.
- Hover the mouse over the column header and click the [
 ] icon to sort the data or arrange the column size or to apply aggregation or to apply filters. NOTE:User needs to select the [Group by <column_name>] on numeric field to view the aggregation option.Preview Dataset
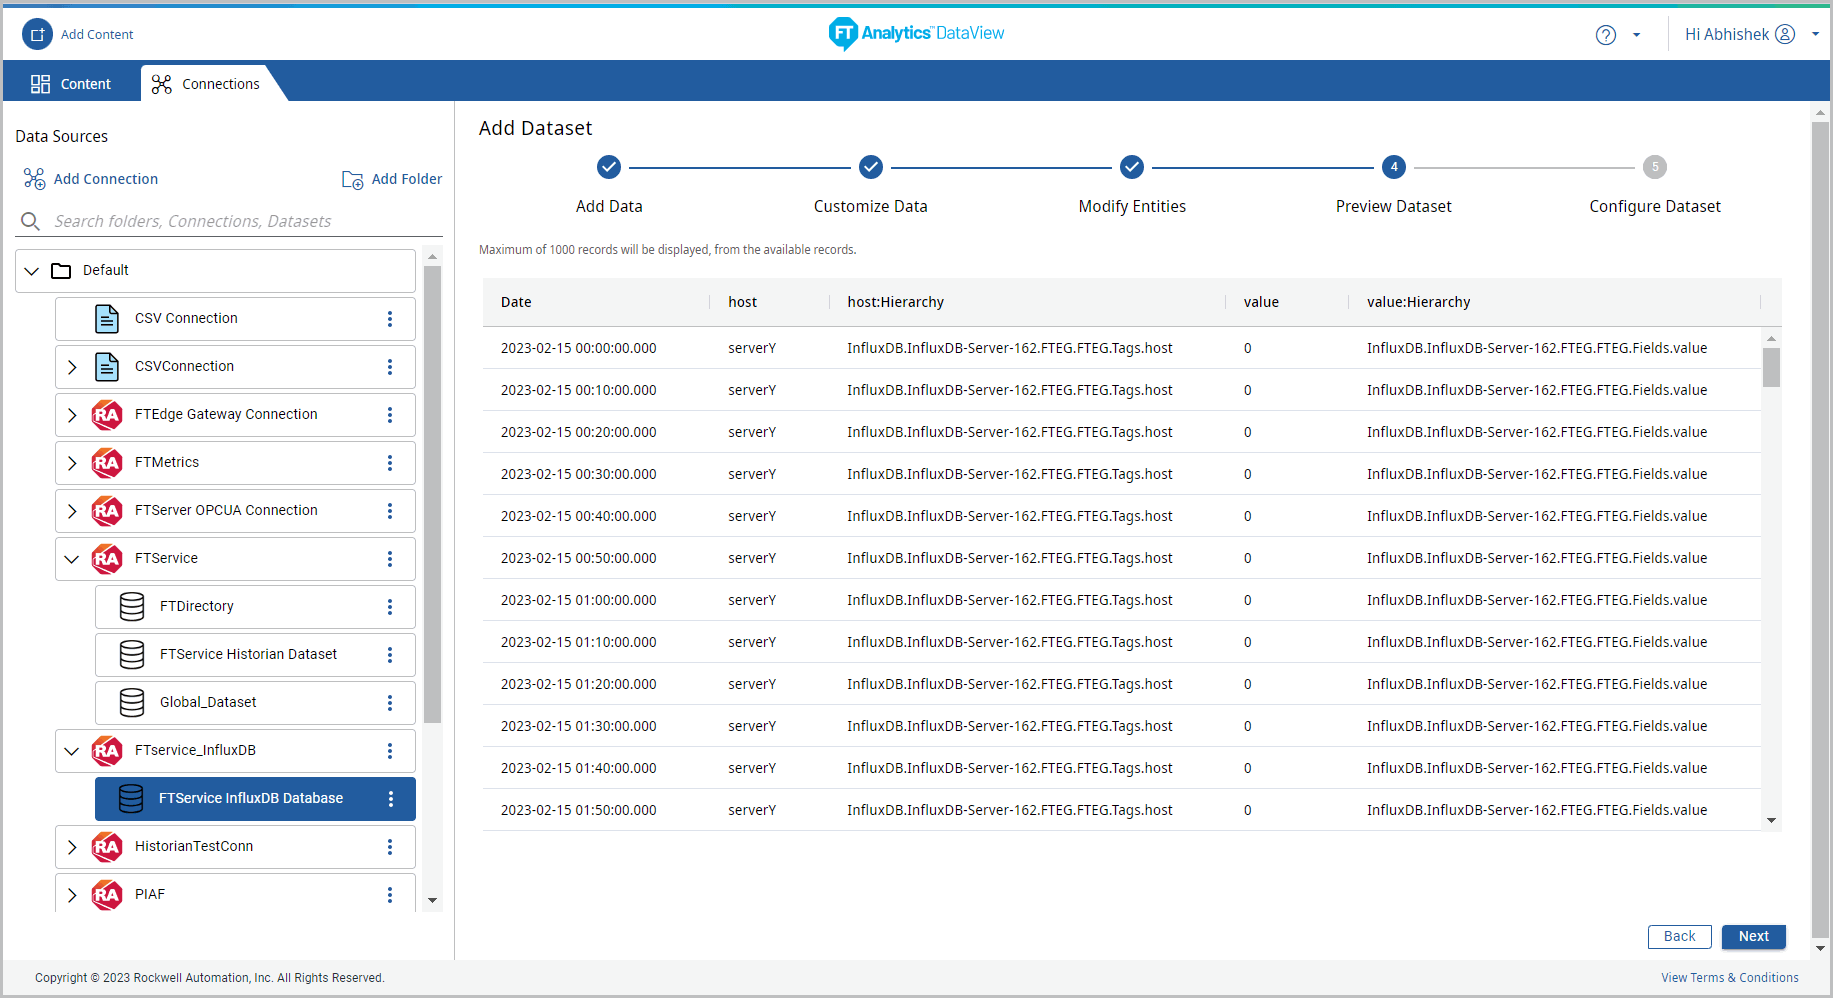 NOTE:If the table contains numeric data in format like 1, 2, 3, 10, 12, 13, 22, 23, 24, 99, 100 and user tries to apply the filter then the data displays in the following sequence: 1, 10, 100, 12, 13, 2, 22, 23, 24, 99.
 - Click [Next]. The Configure Dataset page displays.
- Provide the following details:
- Data Sync Configuration: By default the Sync configuration is set to Full refresh (All rows will be added).
- Data Sync Schedule:
- Default: 30 minutes
- Custom: Select the Time interval to sync data from the Schedule by drop-down list and select the duration.
- Custom Cron Expression: Enables the Users to setup the data synchronization schedule based on the User defined time. For more information on the Custom Cron Expression, refer to User Guide Appendix A, “Custom Cron Expression”.
- Specify the valid Cron expression and click [Validate].
- The “Valid Cron Expression” success message displays.
NOTE:For any timezone, system will sync the data from the last date available in Elasticsearch. Due to any error, if the DataSource has the future timestamp, data sync will not happen. - Default Display Count: From the drop-down list (100, 1000, 10000 or All Available) select the default number of records to display for Charts using this Dataset. By default 100 records is selected.NOTE:Tested till 99999999 number of records to display on Charts.
- Advanced Settings:
- Shards And Replicas: Provide the required number of shards and replicas.NOTE:The default number of shards are one and the replicas are zero. The number of shards and replicas are editable only before saving the Storyboard.
Configure Dataset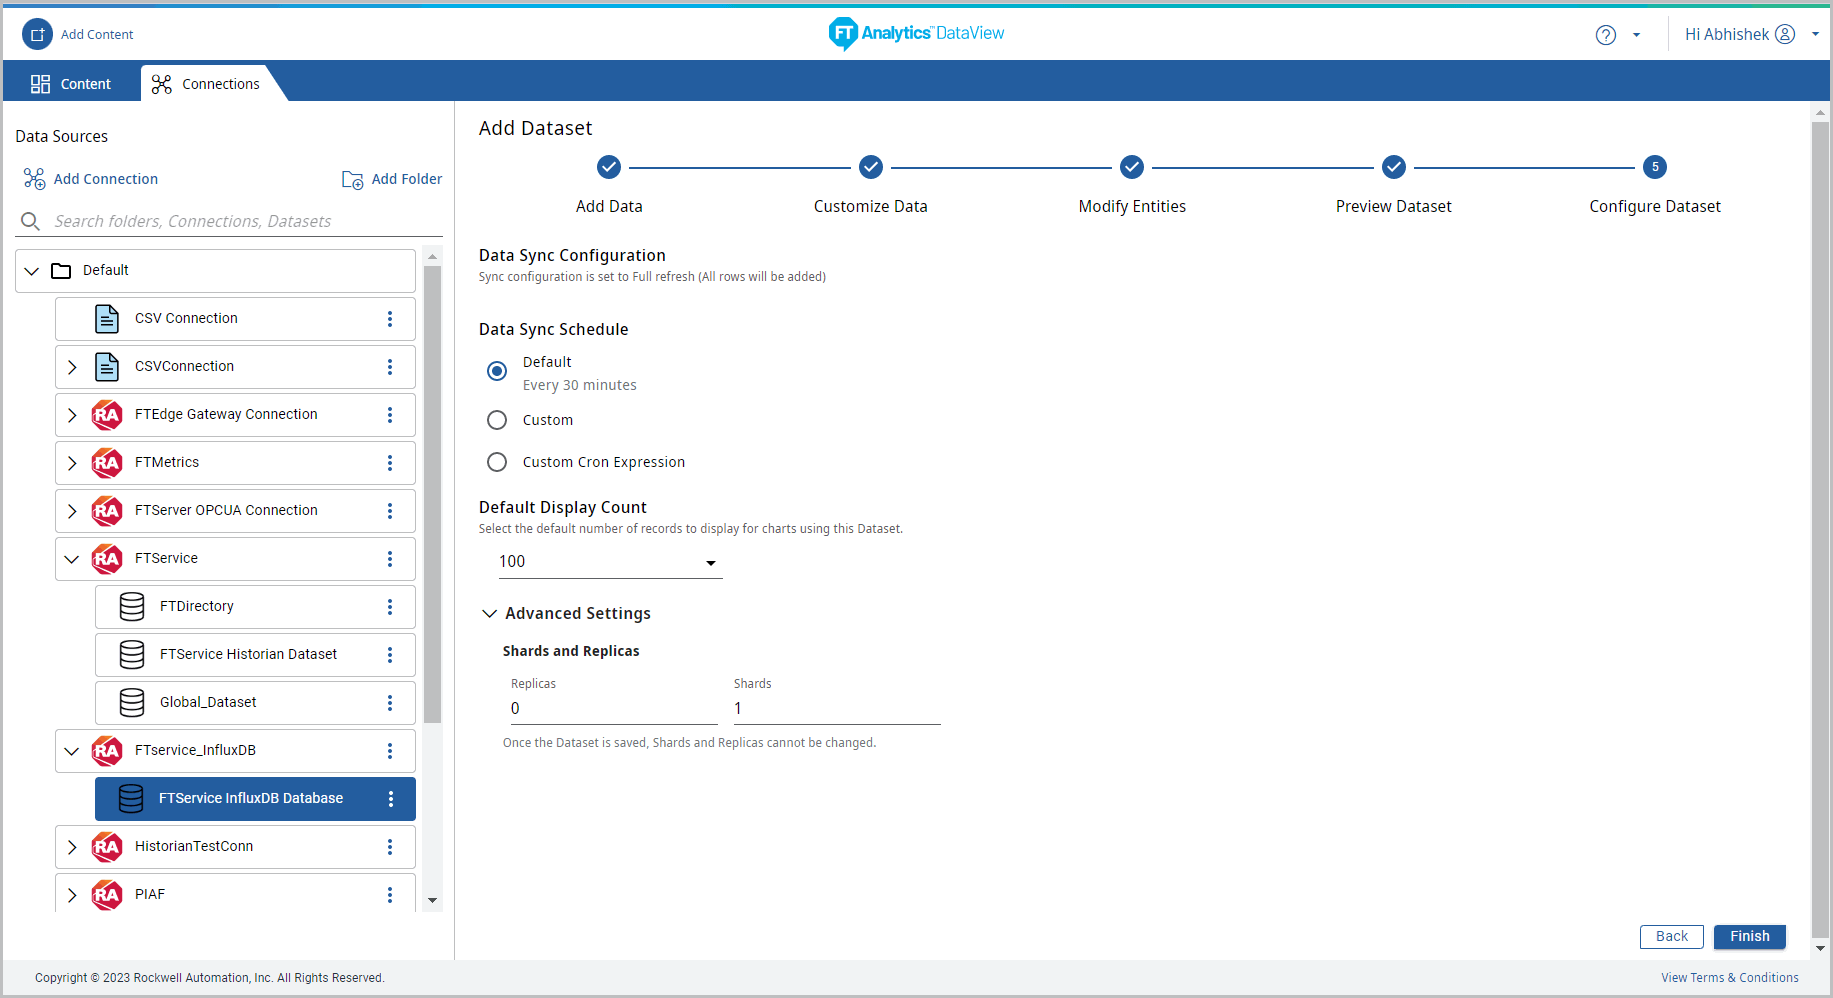
- Click [Finish] the “Dataset Saved Successfully” message displays and “Create a Content for this Dataset.” dialog displays.NOTE:The Dataset and the folders created are arranged in ASCII order.Create Content
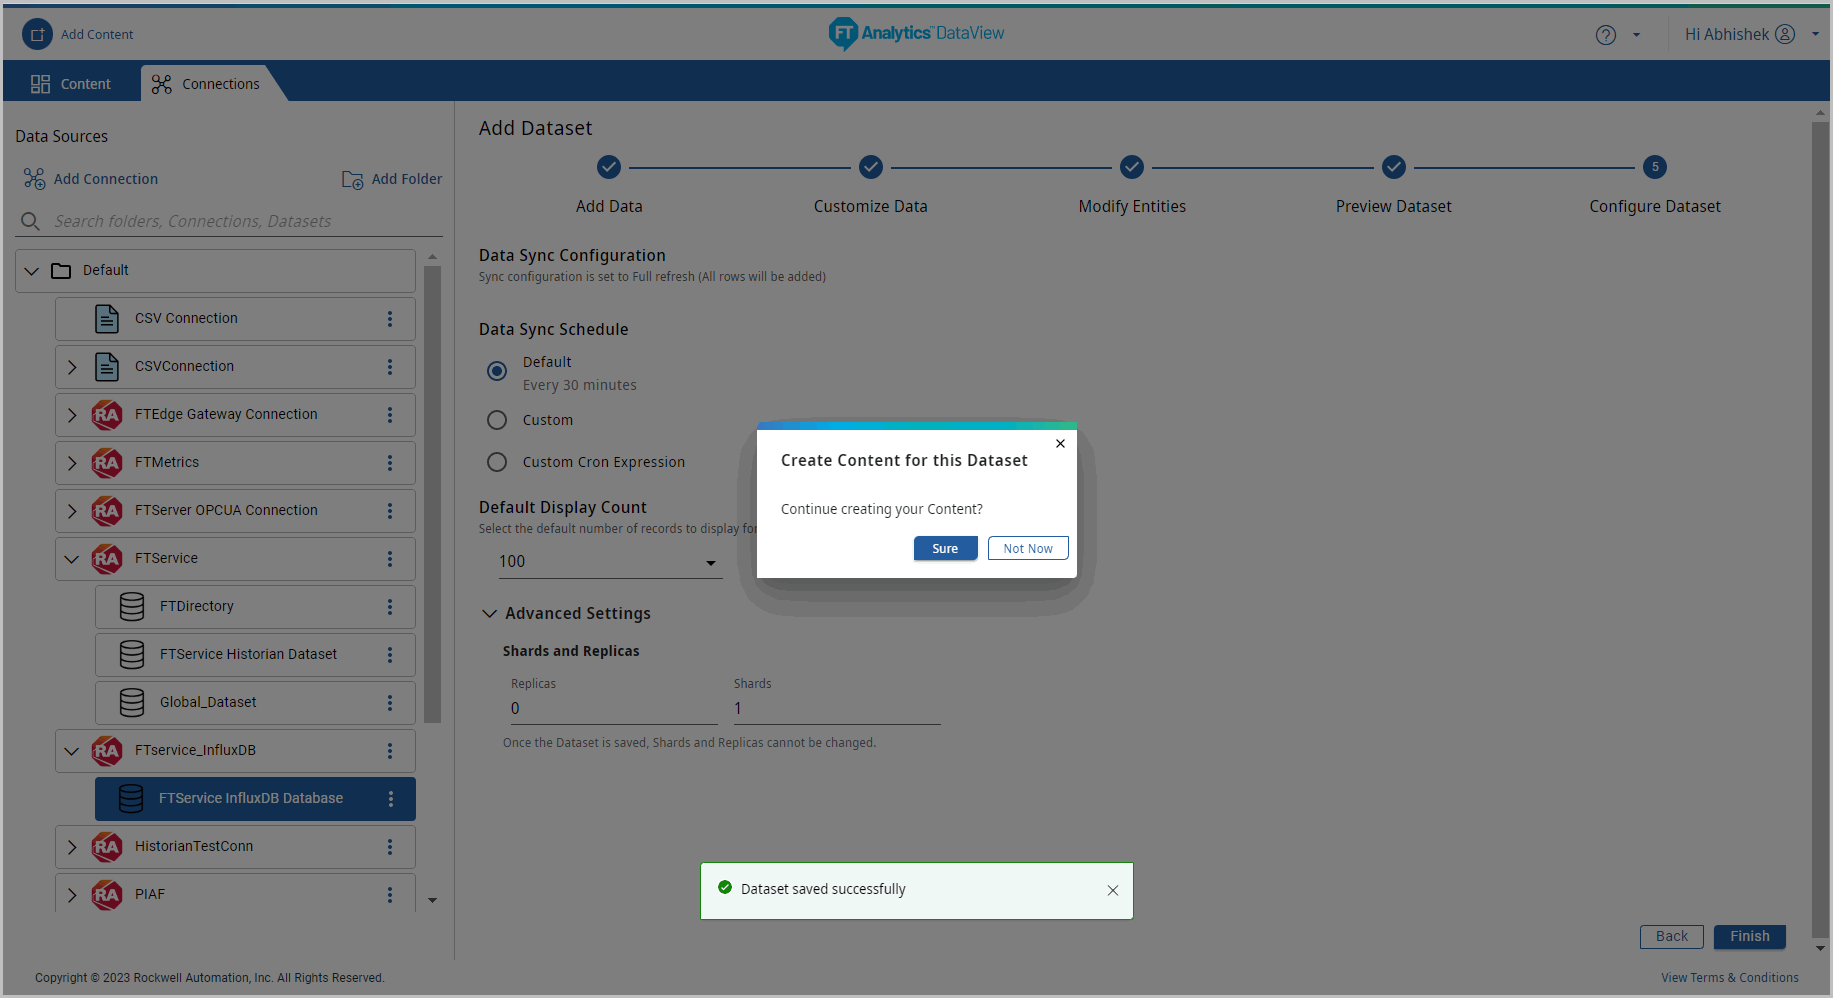
- Click [Finish] the “Dataset Saved Successfully” message displays and “Create a Storyboard for this Dataset.” dialog displays.NOTE:The Dataset and the folders created are arranged in ASCII order.
- Dataset Information: Click the new Dataset and navigate through the tabs to view respective information:
- Details tab: Displays the Dataset created information and Dataset Sync information.
- The following details are displayed for the dataset created with Indirect query:
- Dataset Information: Dataset Name, Data Source, Connection Name, Query Type, Source Time Zone, Created By, Created On, Updated By, Last Updated, Replicas, and Shards.
- Dataset Sync Information: Data Sync Configuration and Data Sync Schedule.
Dataset Information - Indirect Query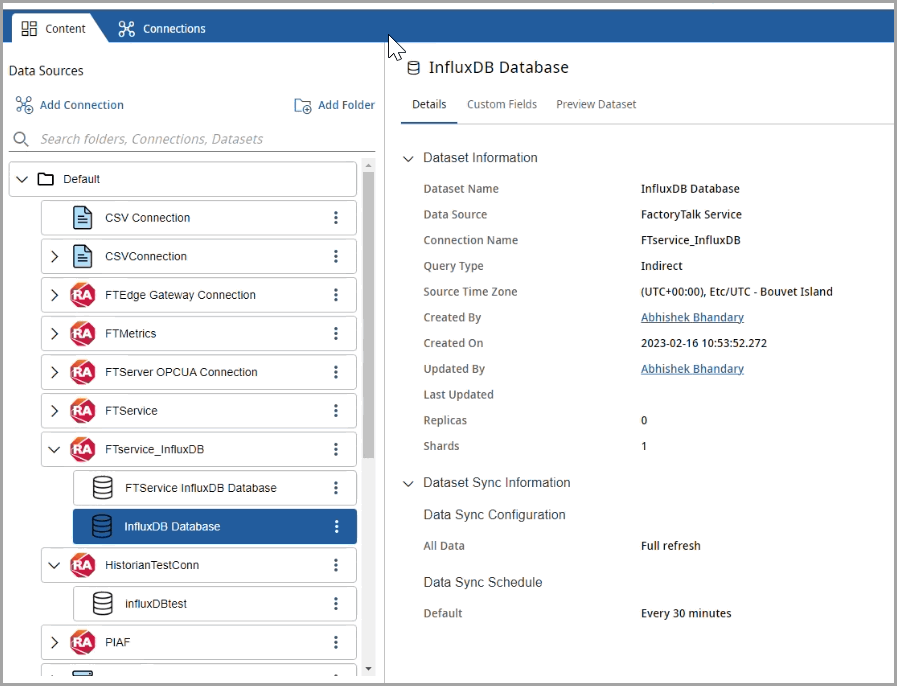
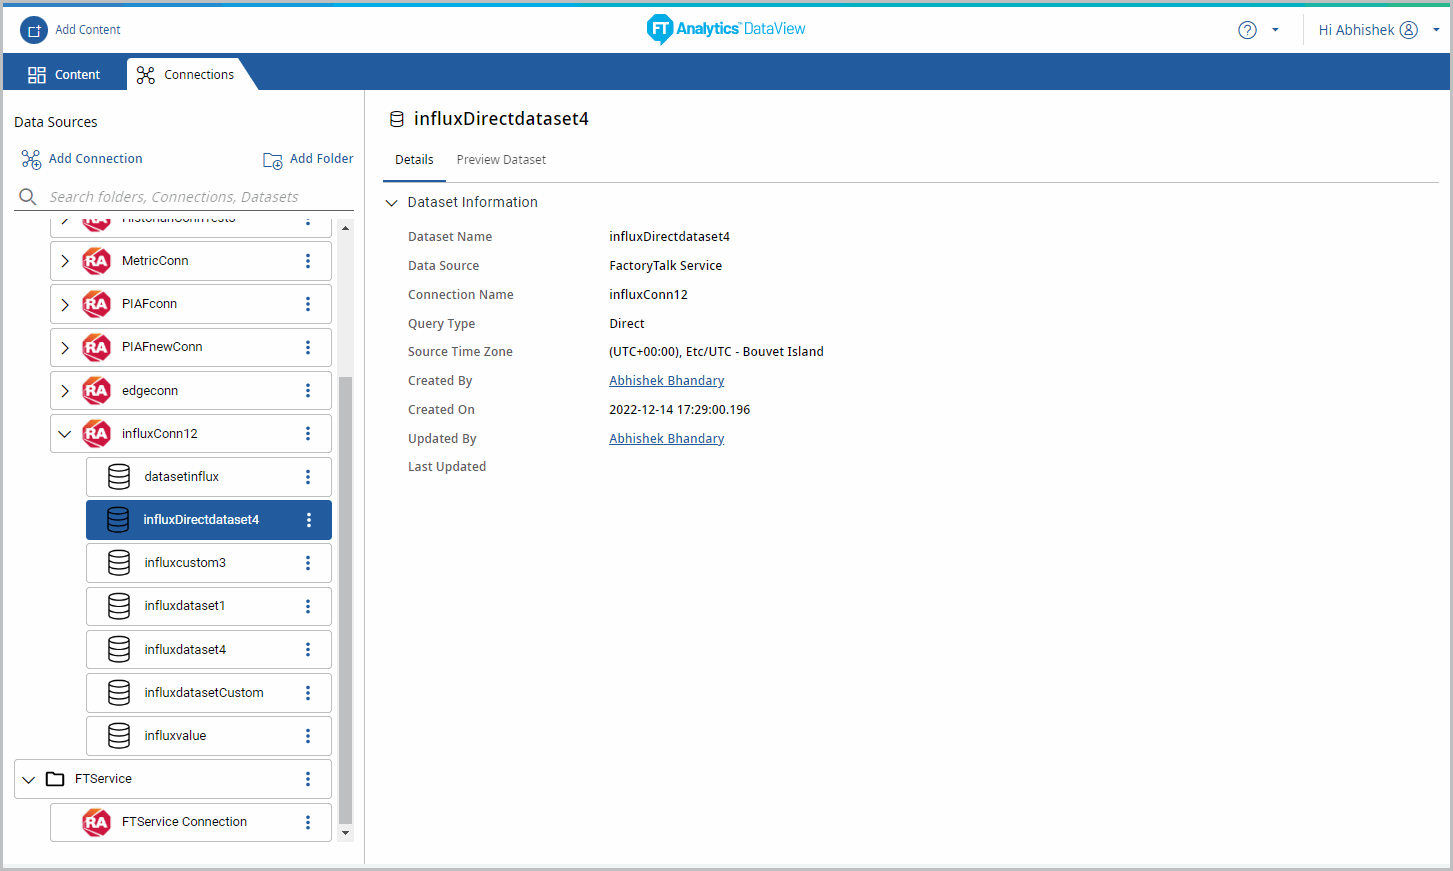
- The following details are displayed for the dataset created with Direct query:
- Dataset Information: Dataset Name, Data Source, Connection Name, Query Type, Source Time Zone, Created By, Created On, Updated By, and Last Updated.Dataset Information - Direct Query
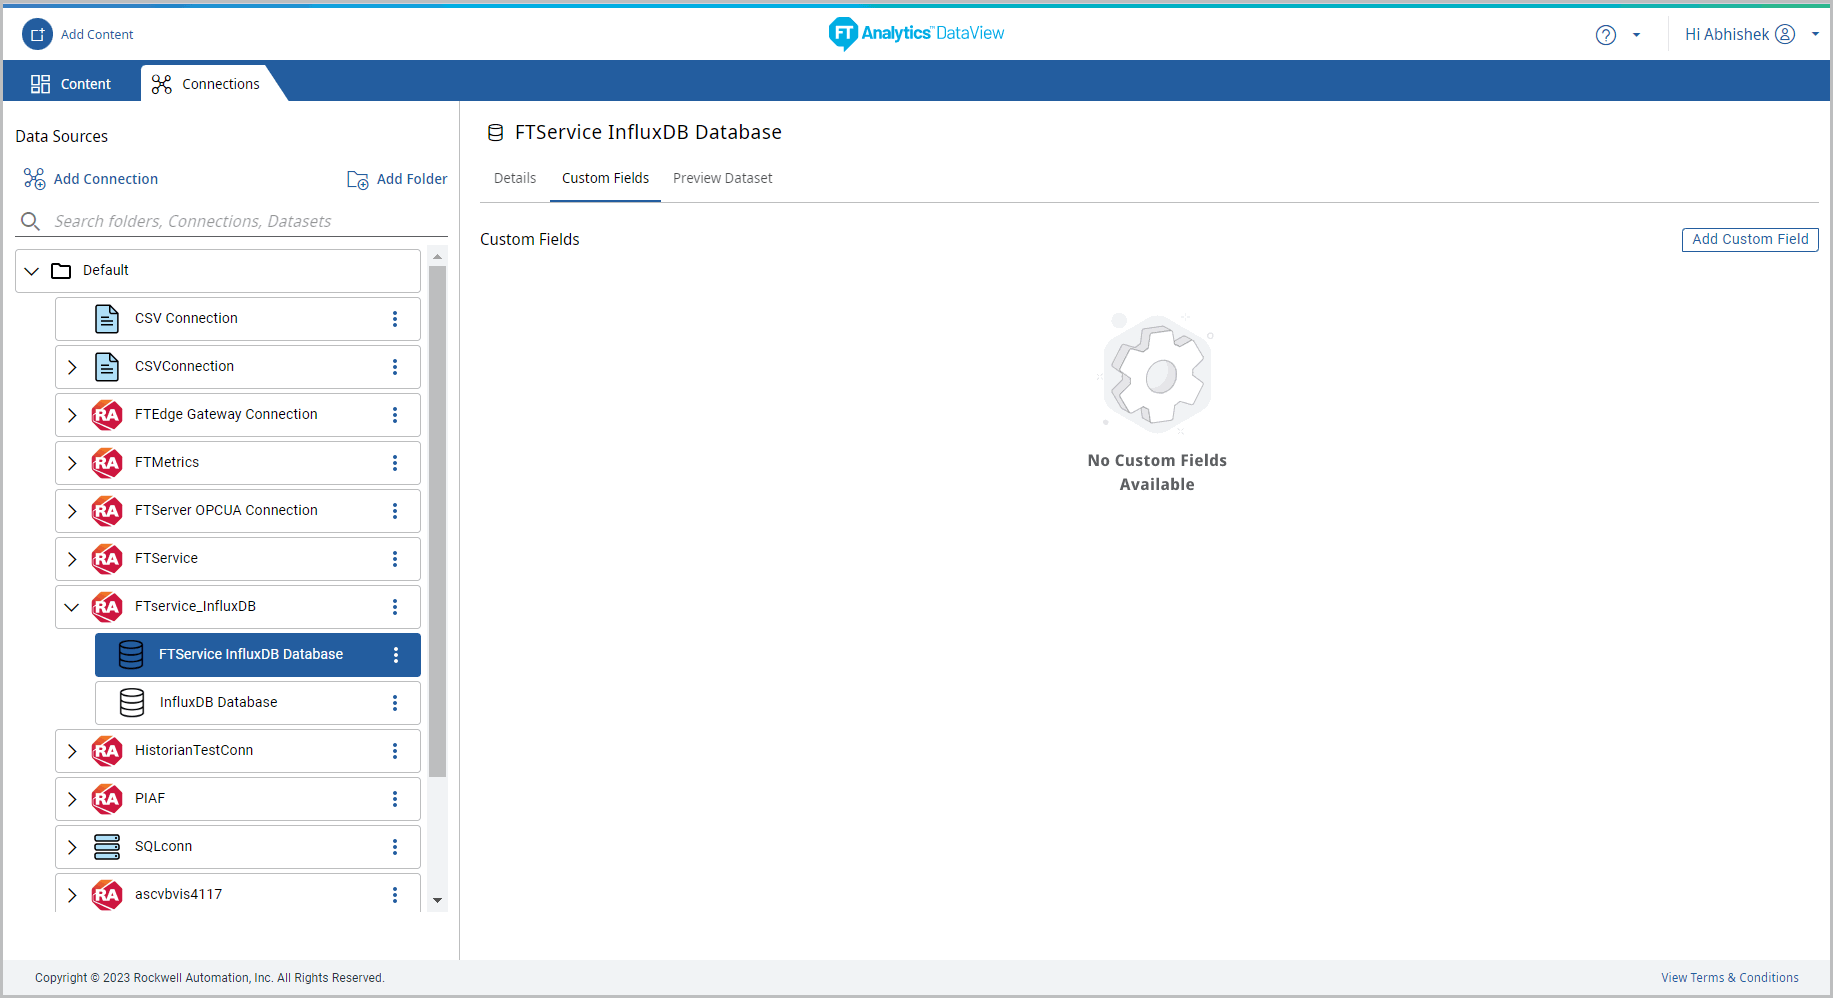
- Custom Fields: Displays the created Custom fields for the dataset created with indirect Query only. Click [Add Custom Field] to create a new custom field.Custom Field
- The Custom Fields dialog displays. Provide the following details:
- Provide the Custom Field name.
- Define the formula in the Add Formula editor box. User can create the Custom Field in dataset with Numeric or String or Date type data.NOTE:User can paste the formula in the Add Formula Editor box.
- Click [Validate] to validate the formula. The “Formula Validated Successfully” message displays.
- Click [Add]. The “Custom Field saved Successfully” message displays.
- Preview Dataset: Displays the Dataset preview for 1000 rows by default. Click the column header to apply filter to the columns or to select the columns to display on the Preview Dataset panel.
Provide Feedback
