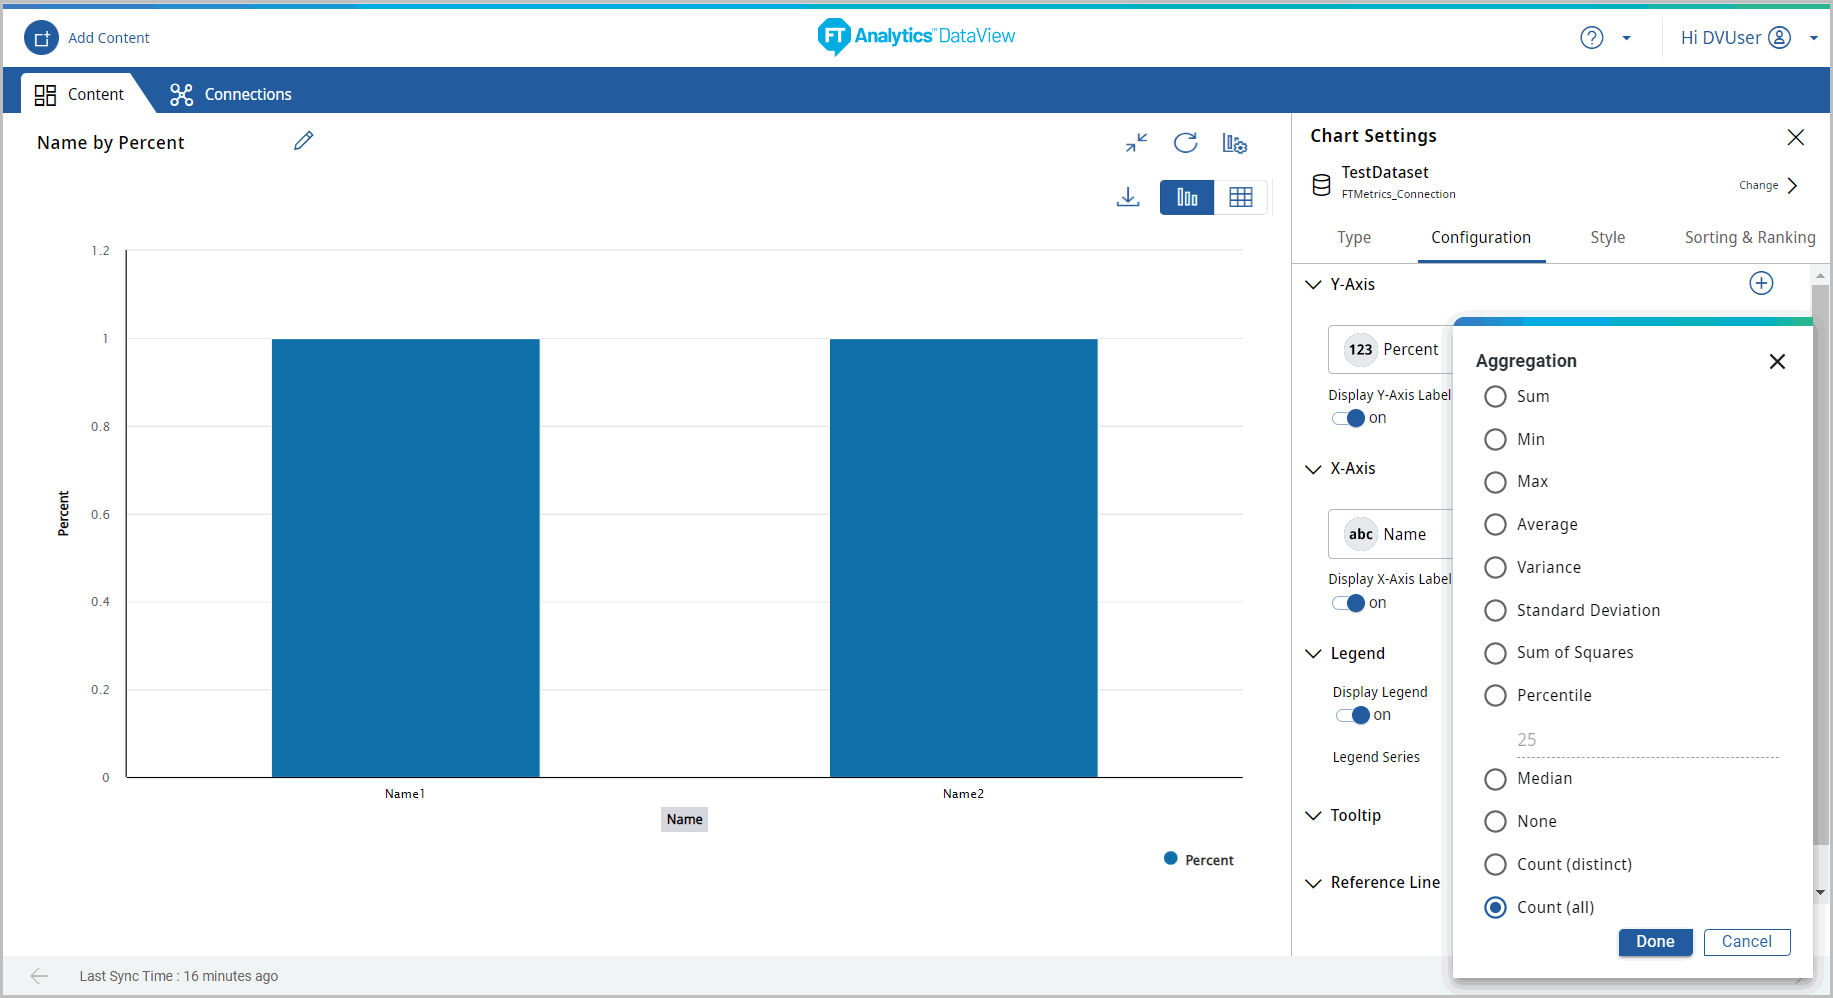
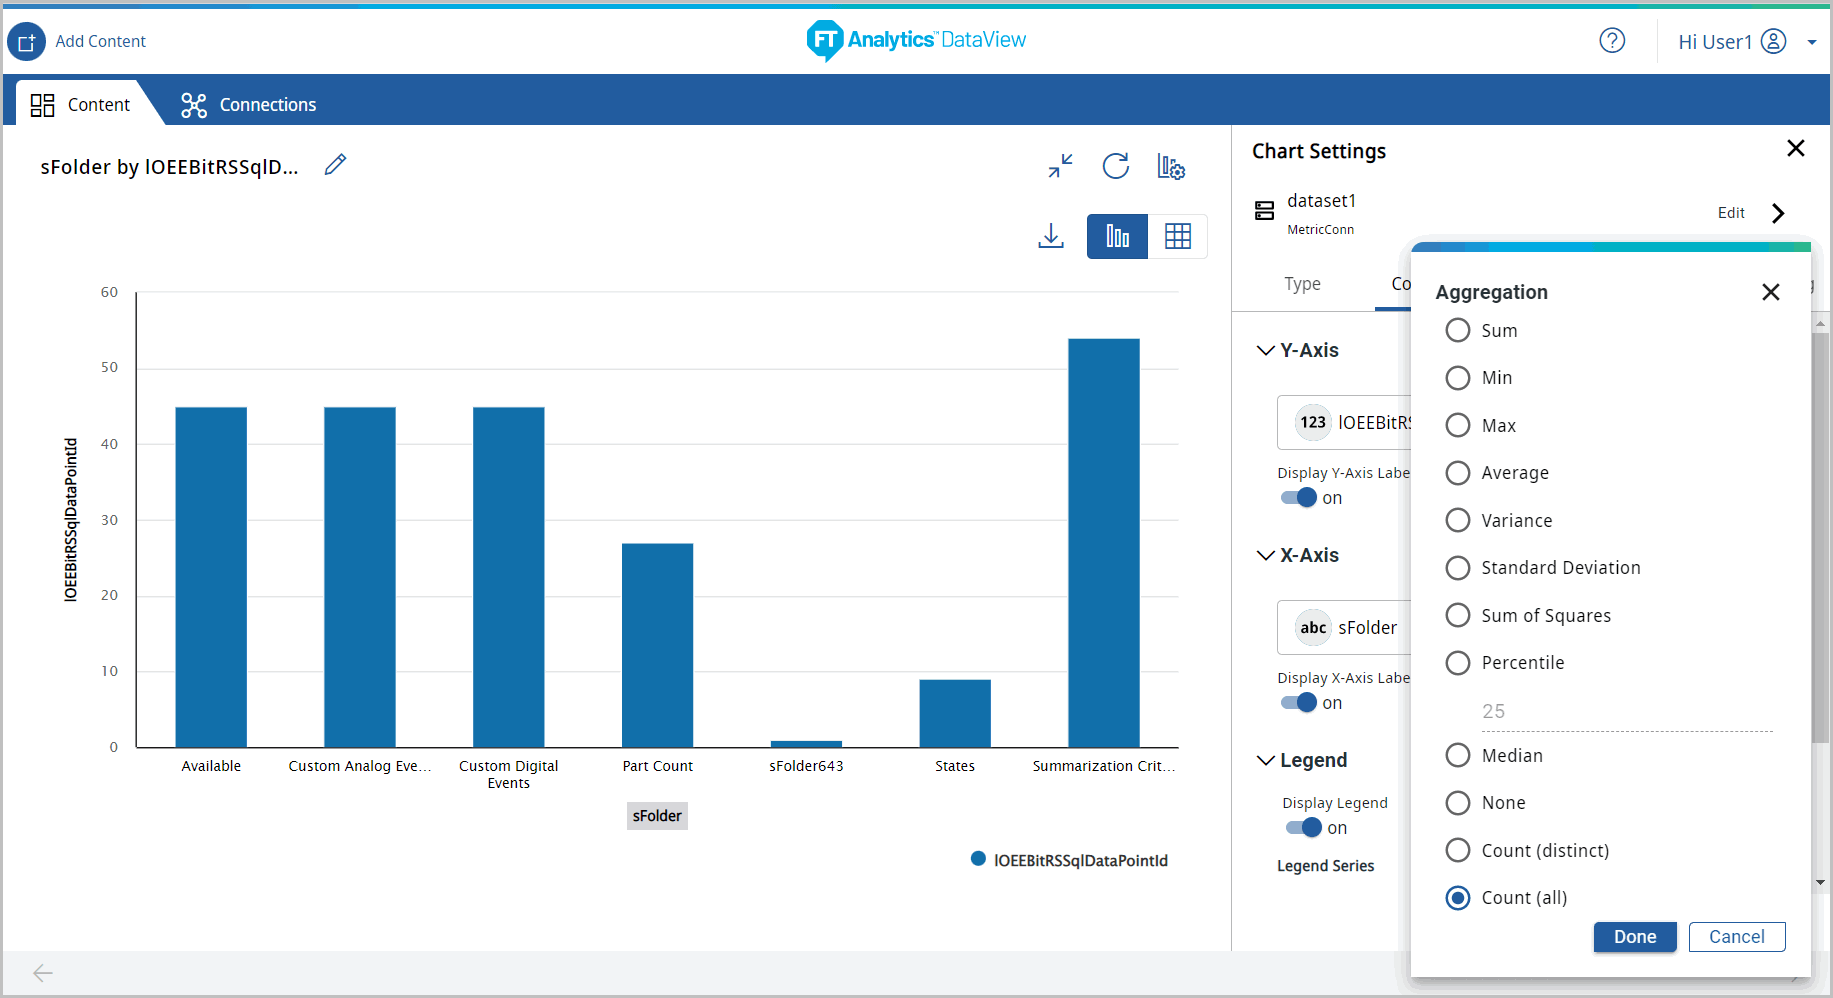
Aggregations
- Aggregation types can be changed by selecting the measure drop-down list.Select Aggregation
- The fields or columns loaded in this section are Number or Numeric values. Technically called Integers, Decimals, etc.
- Aggregations are applied against the numeric columns in Y-Axis.
- The aggregations available are listed below:When Direct Query is enabled, refer to the Chart Aggregation section in the “Supported Features - Direct Query and Non-Direct Query” table for the list of aggregations.
- Sum
- Min
- Max
- Average
- Variance
- Standard Deviation
- Sum of Squares
- Percentile
- Median
- None
- Count (distinct)
- Count (all)
NOTE:To view the raw data (without aggregation) in the chart, select [None] in Y-Axis.
Chart Settings - Aggregation
- User can configure multiple aggregate functions on Y-Axis.
Example
: Select the aggregate function, count
, average
and max
to Output.Max-Output
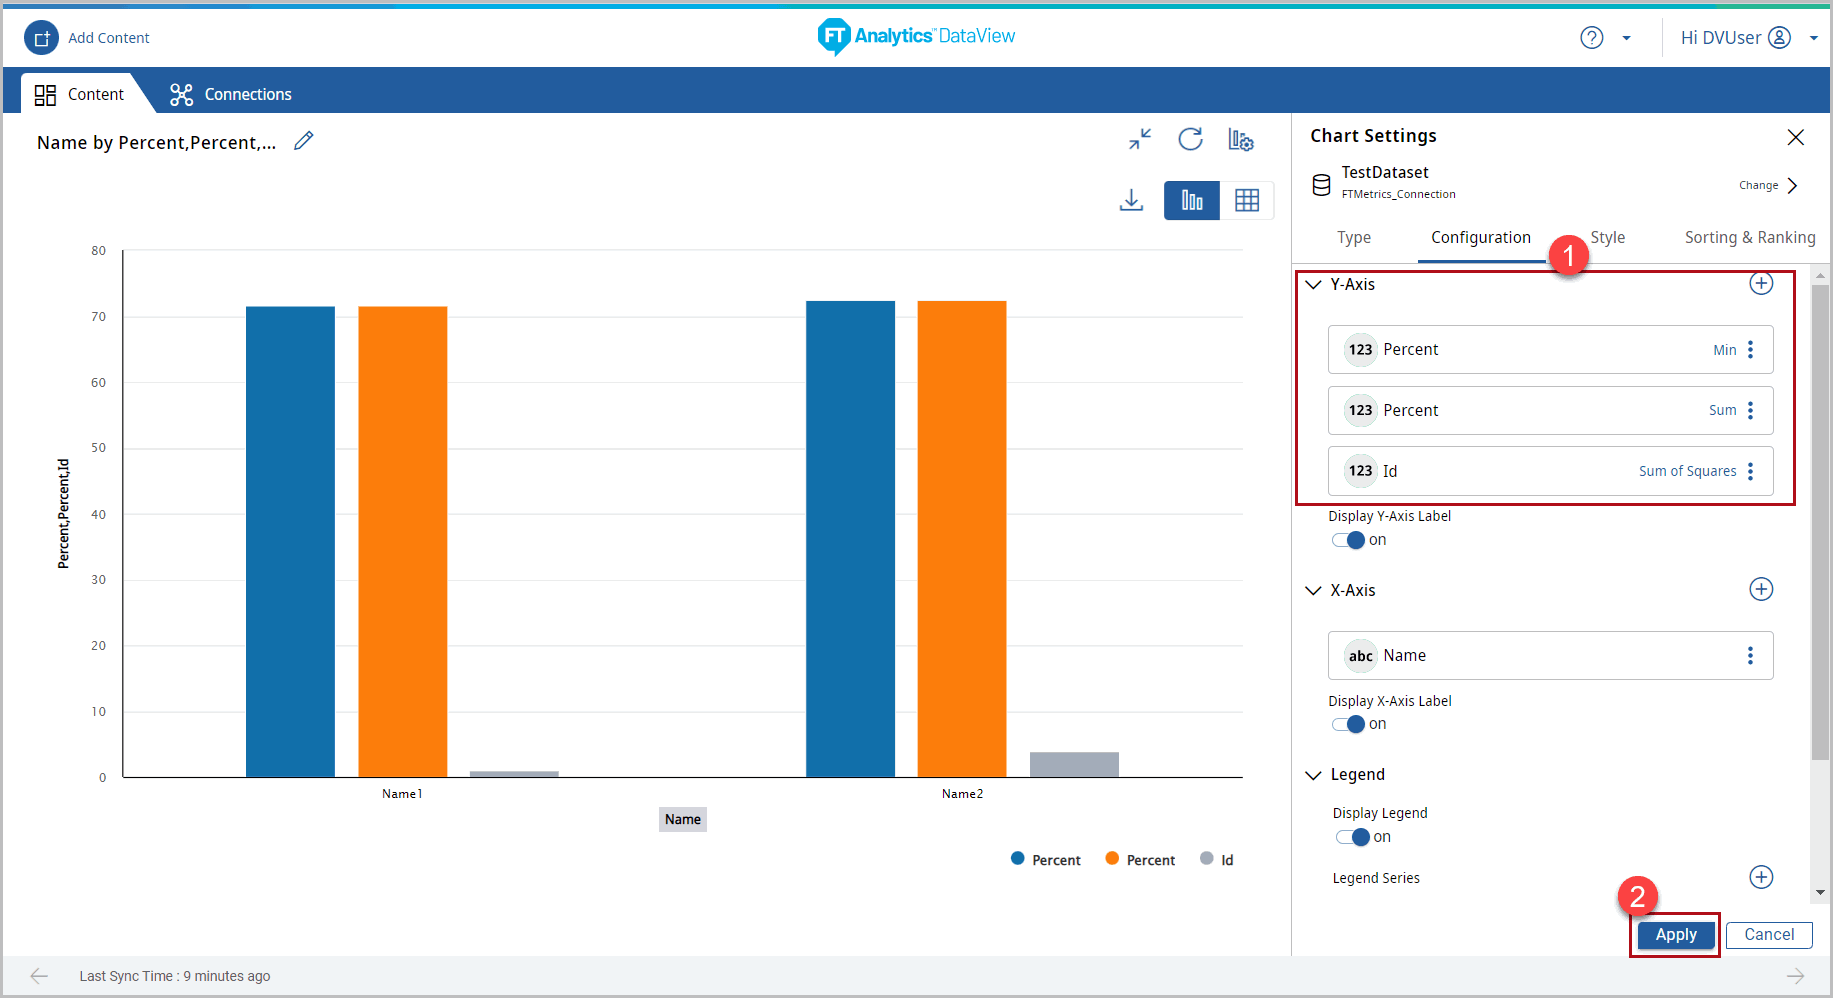
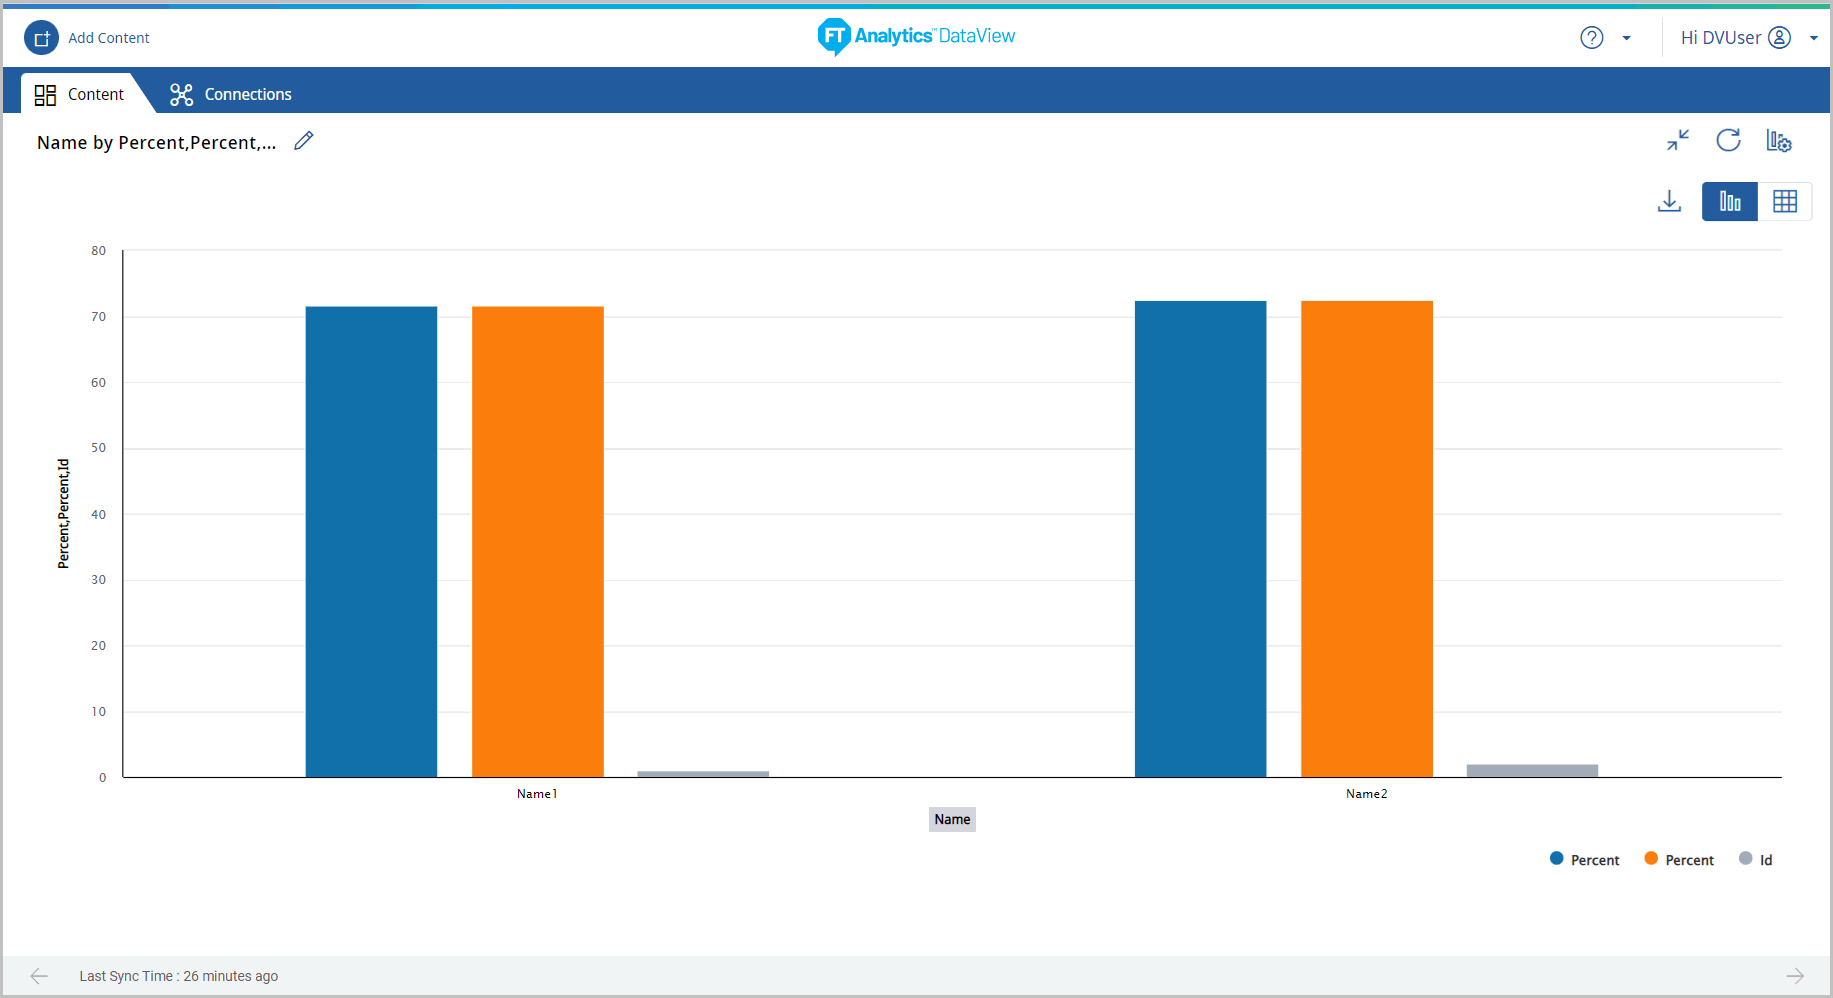
The chart with multiple aggregate functions on Y-Axis displays
Result - Multiple Aggregate Functions
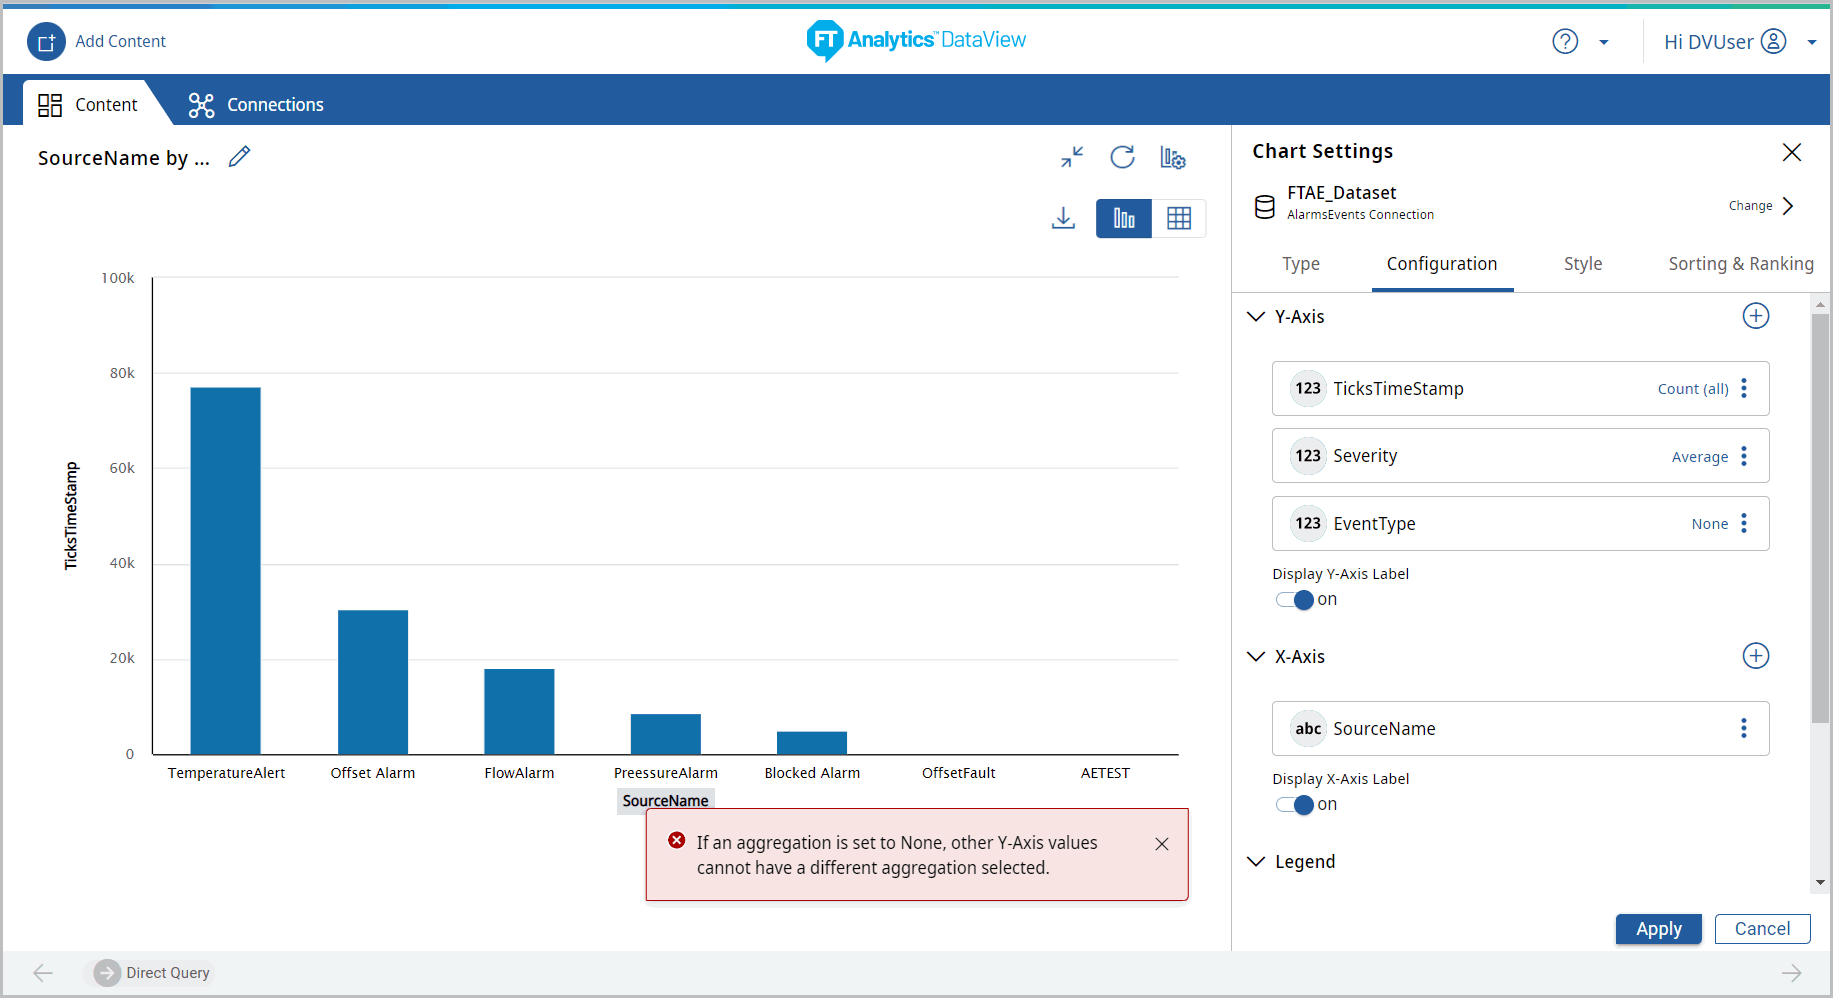
- In the Direct Query chart, if None aggregation is selected with other aggregations on Y-Axis a warning message ‘If an aggregation is set to None, other Y-Axis values cannot have a different aggregation selected.’ displays.Multiple Aggregate Functions Warning Message
Provide Feedback