Gantt Chart
The Gantt chart enables the User to monitor different machines state against specified time period.
Gantt chart visualizes the work breakdown structure for projects. It illustrates the time intervals of the project tasks and their dependencies. The breakdown of the project is described in tasks which are listed on the vertical axis where the duration of the tasks is offset against the horizontal axis.
NOTE:
The Gantt chat option is available only on Metrics Plant Manager template.
Perform the following steps to generate a Storyboard with Gantt chart:
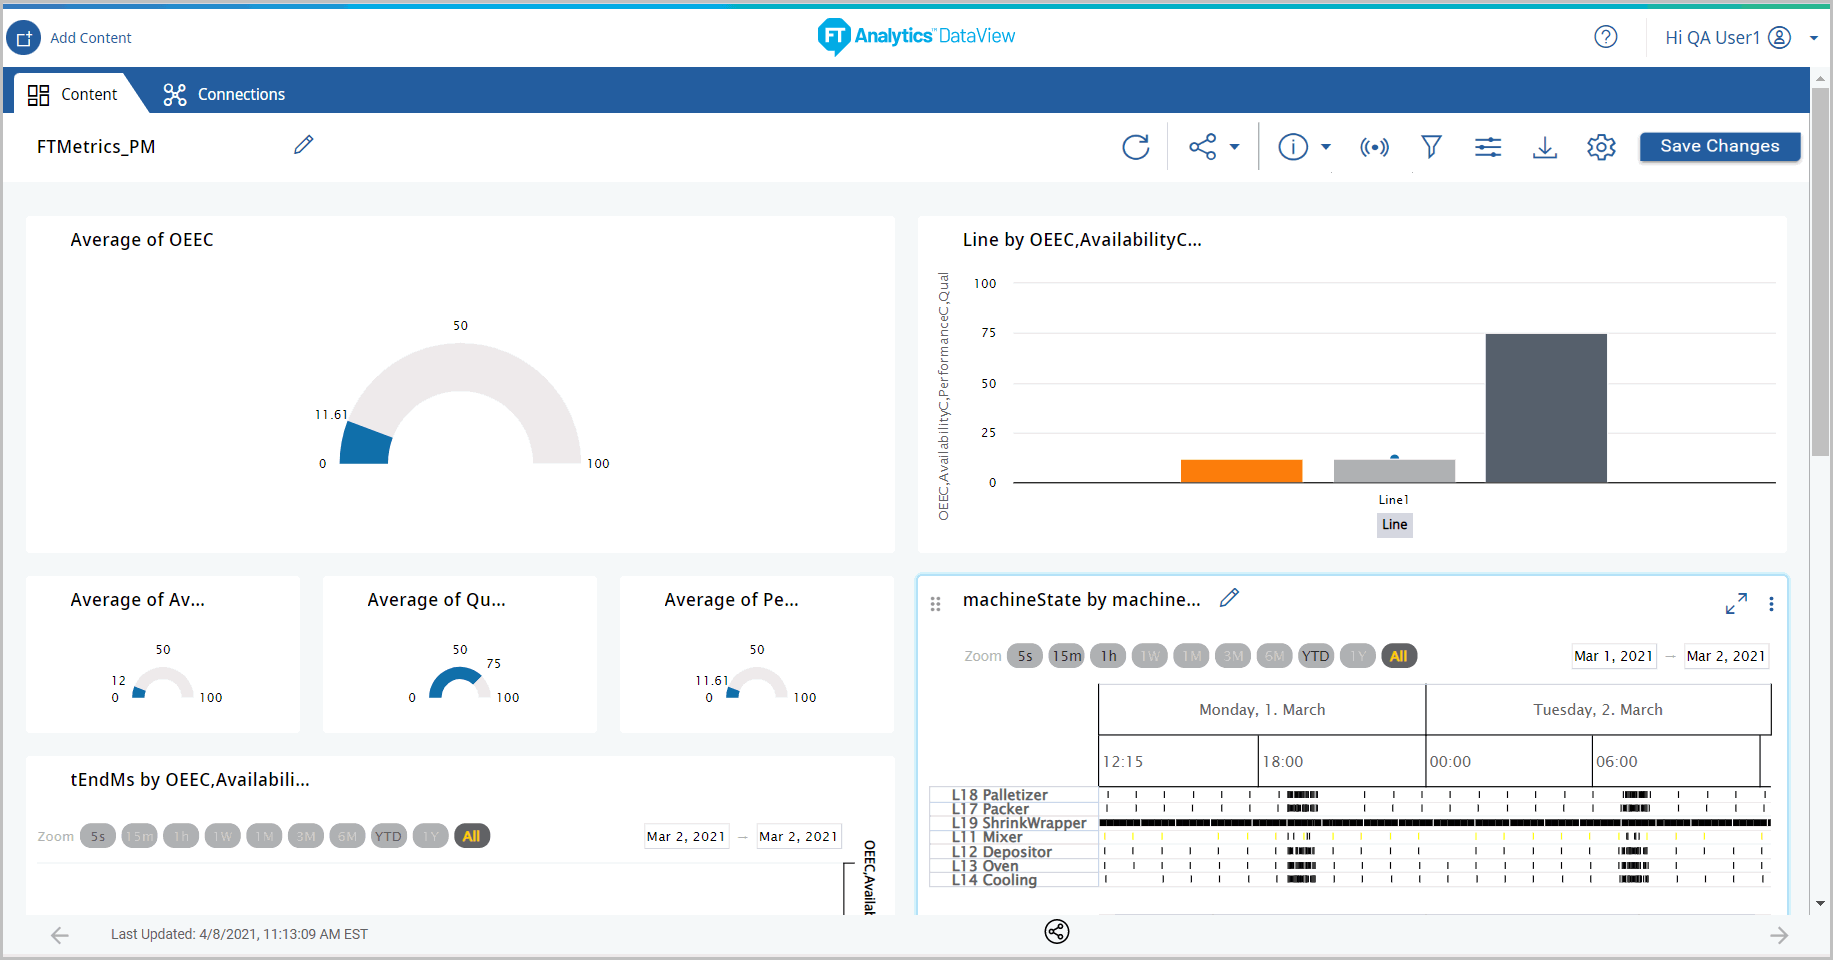
- Generate a Storyboard with Metrics Plant Manager template.
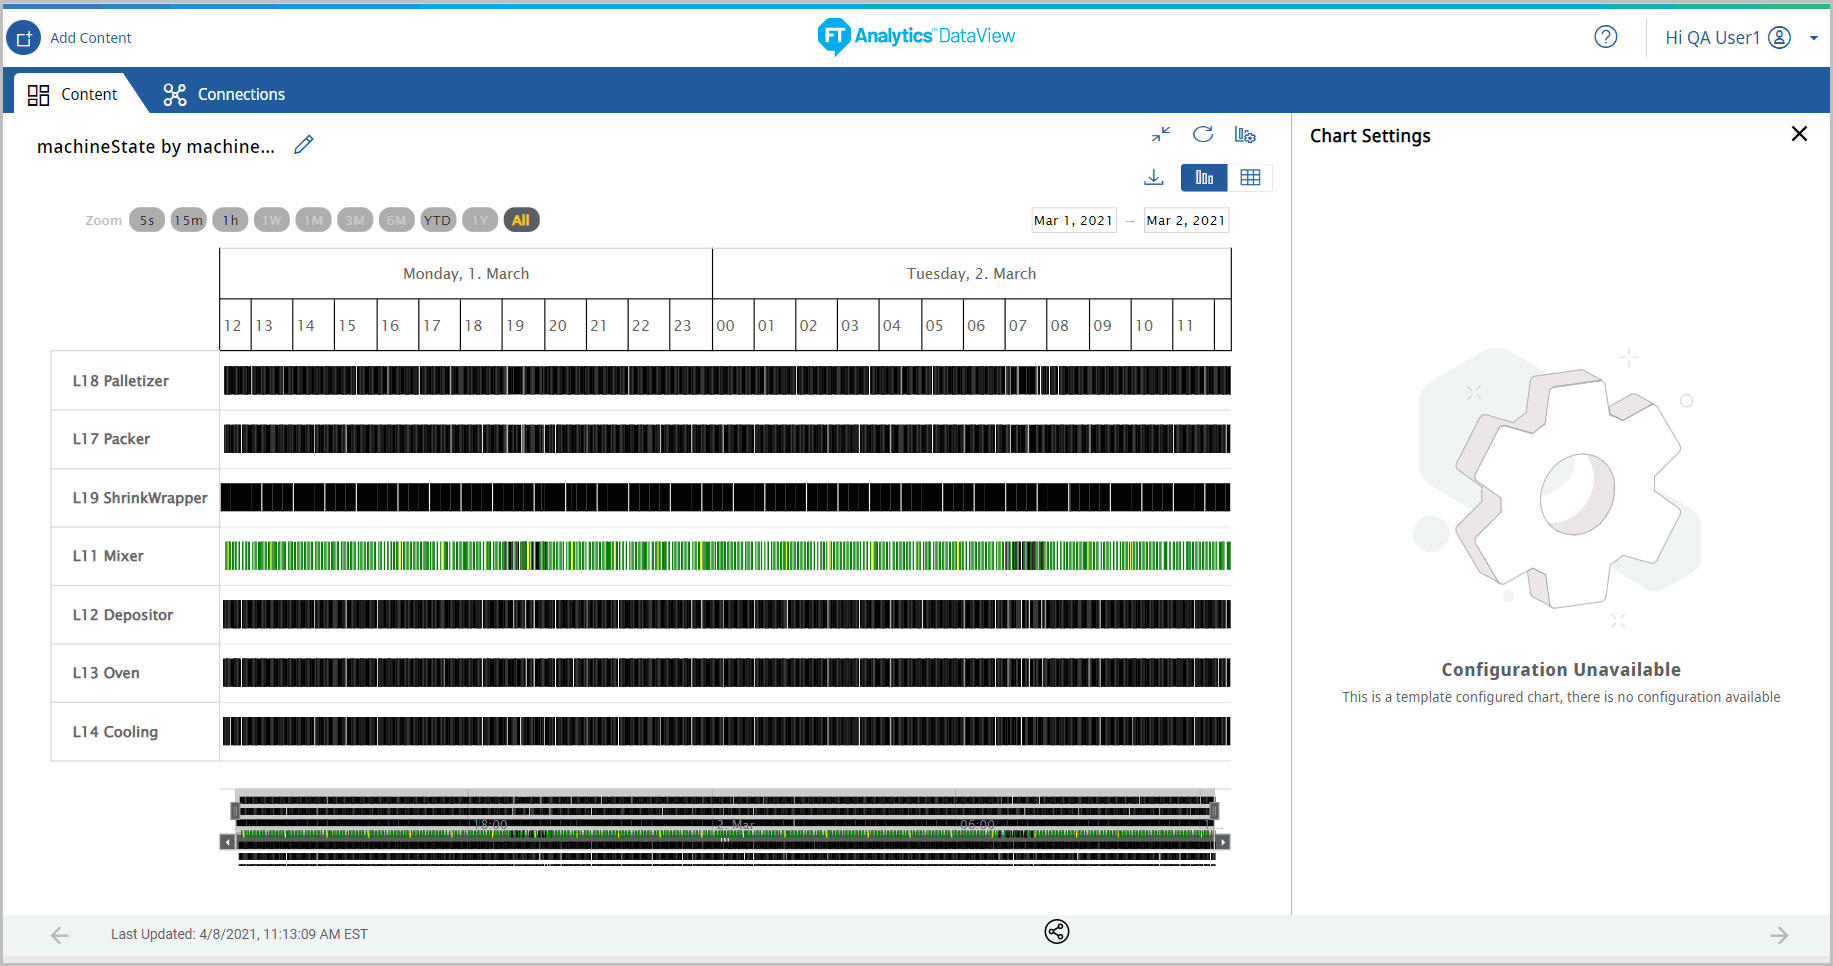
- The Storyboard with Gantt chart displays.Storyboard Gantt Chart
- Expand the Gantt chart tile to view the data.Storyboard Updated
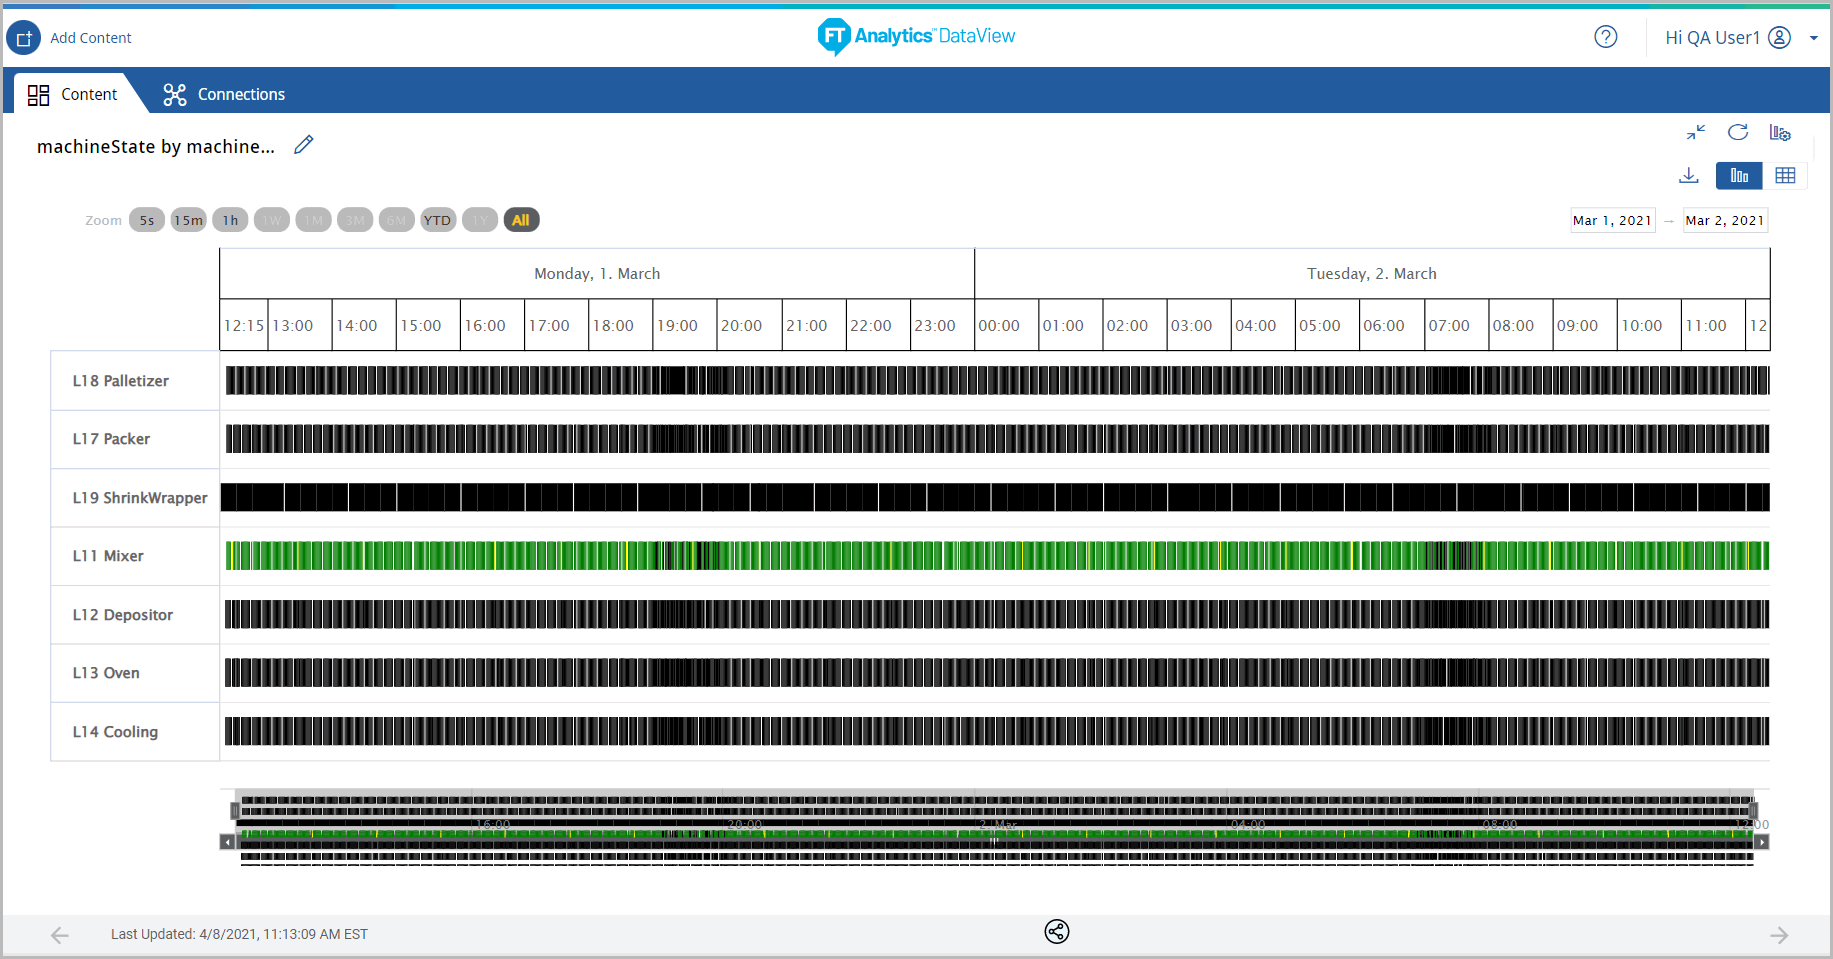
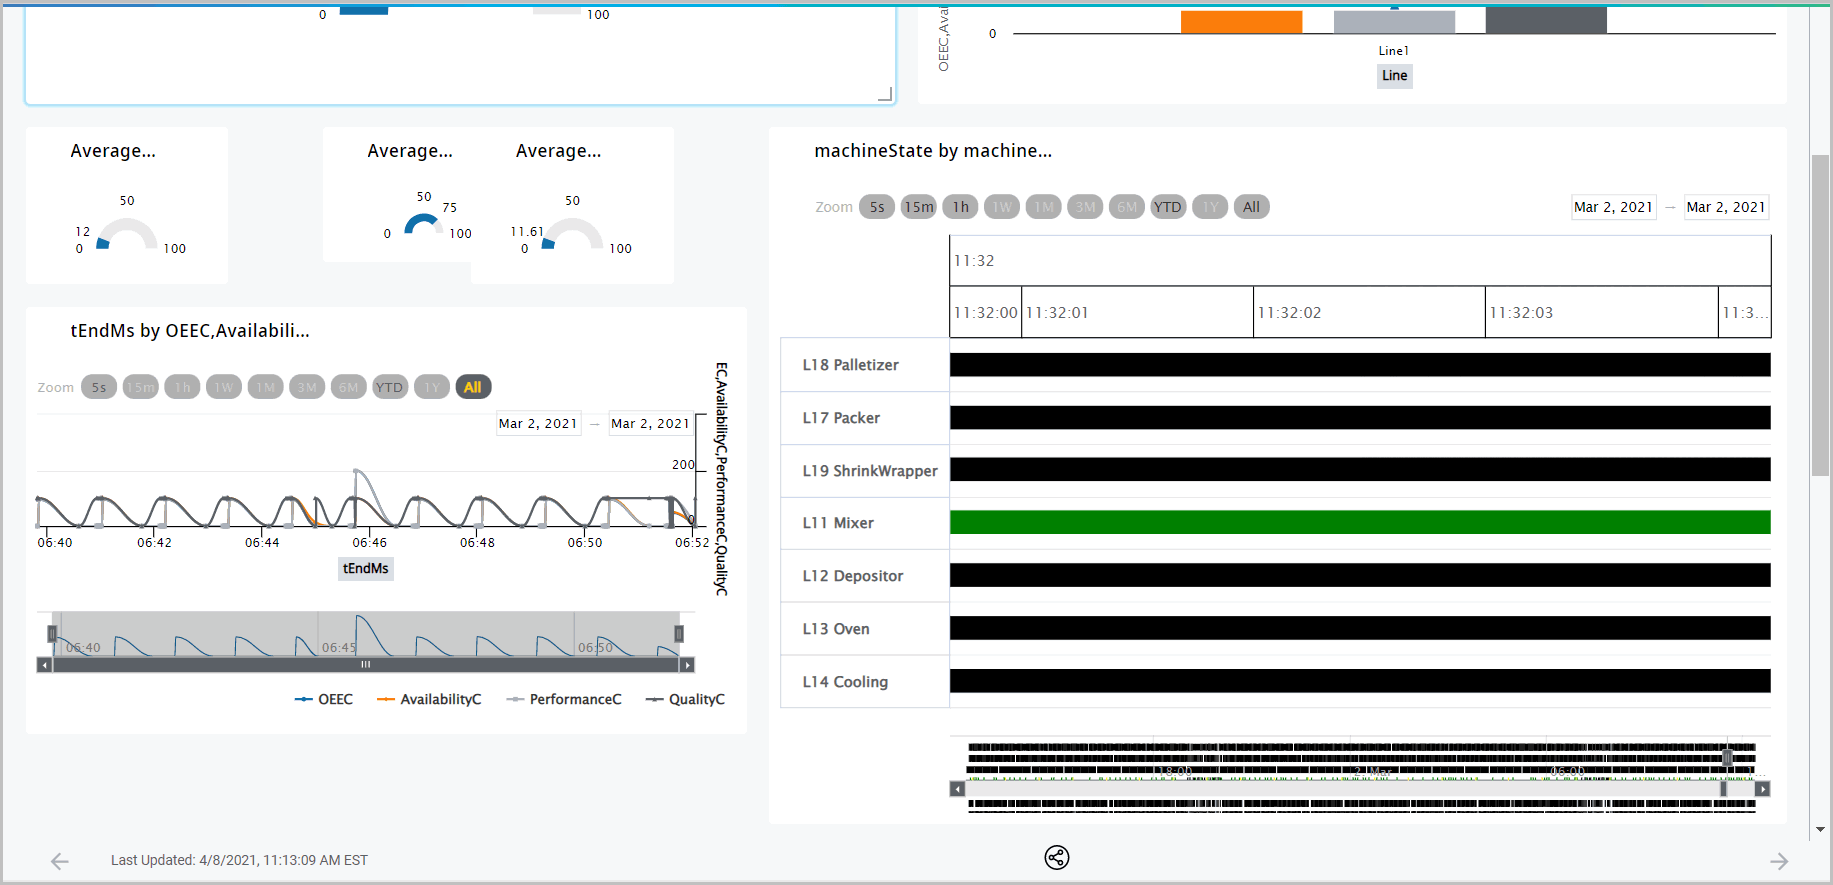
- Gantt chart enables the User to zoom the data with various options.
- Select any one of the options to zoom the chart: 5 sec, 15 min, 1 hr, 1 week, 1 month, 3 months, YTD, 1 Y
- Click [All] to view all the data.(OR)Select the data and on X-Axis to zoom in.(OR)Drag the time selector at bottom of chart to view data from specific time period.
Storyboard Updated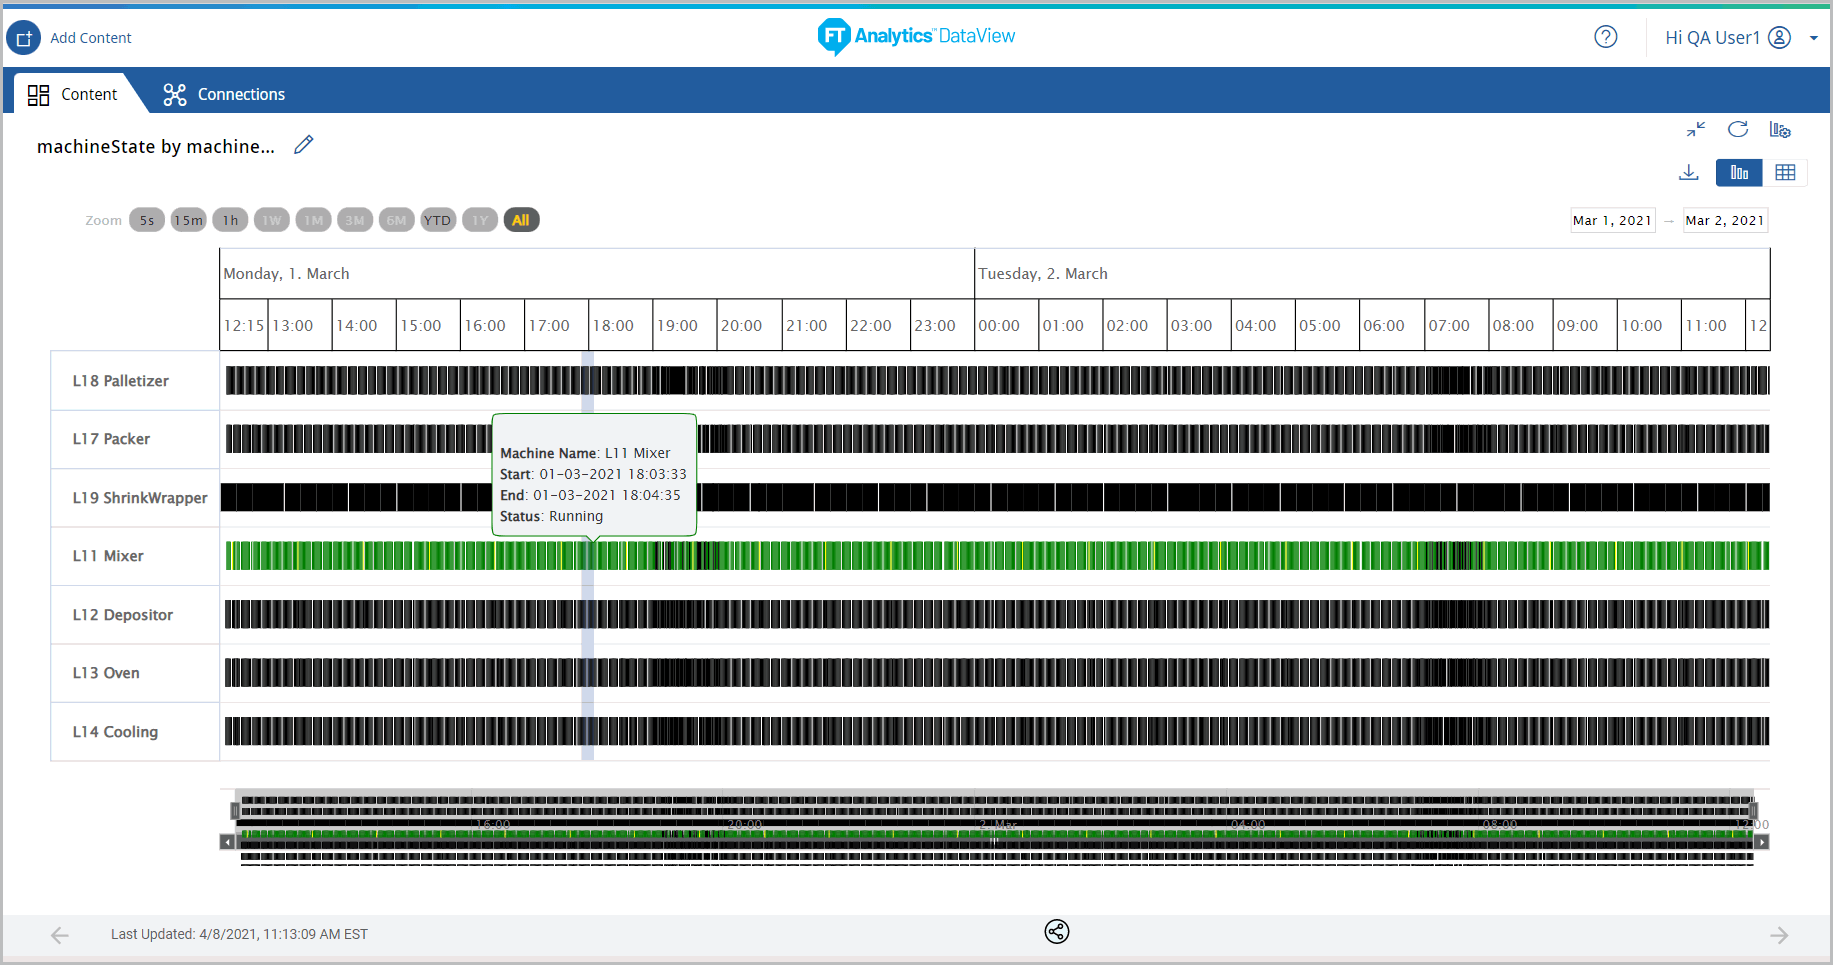 The updated chart displays.Storyboard Updated
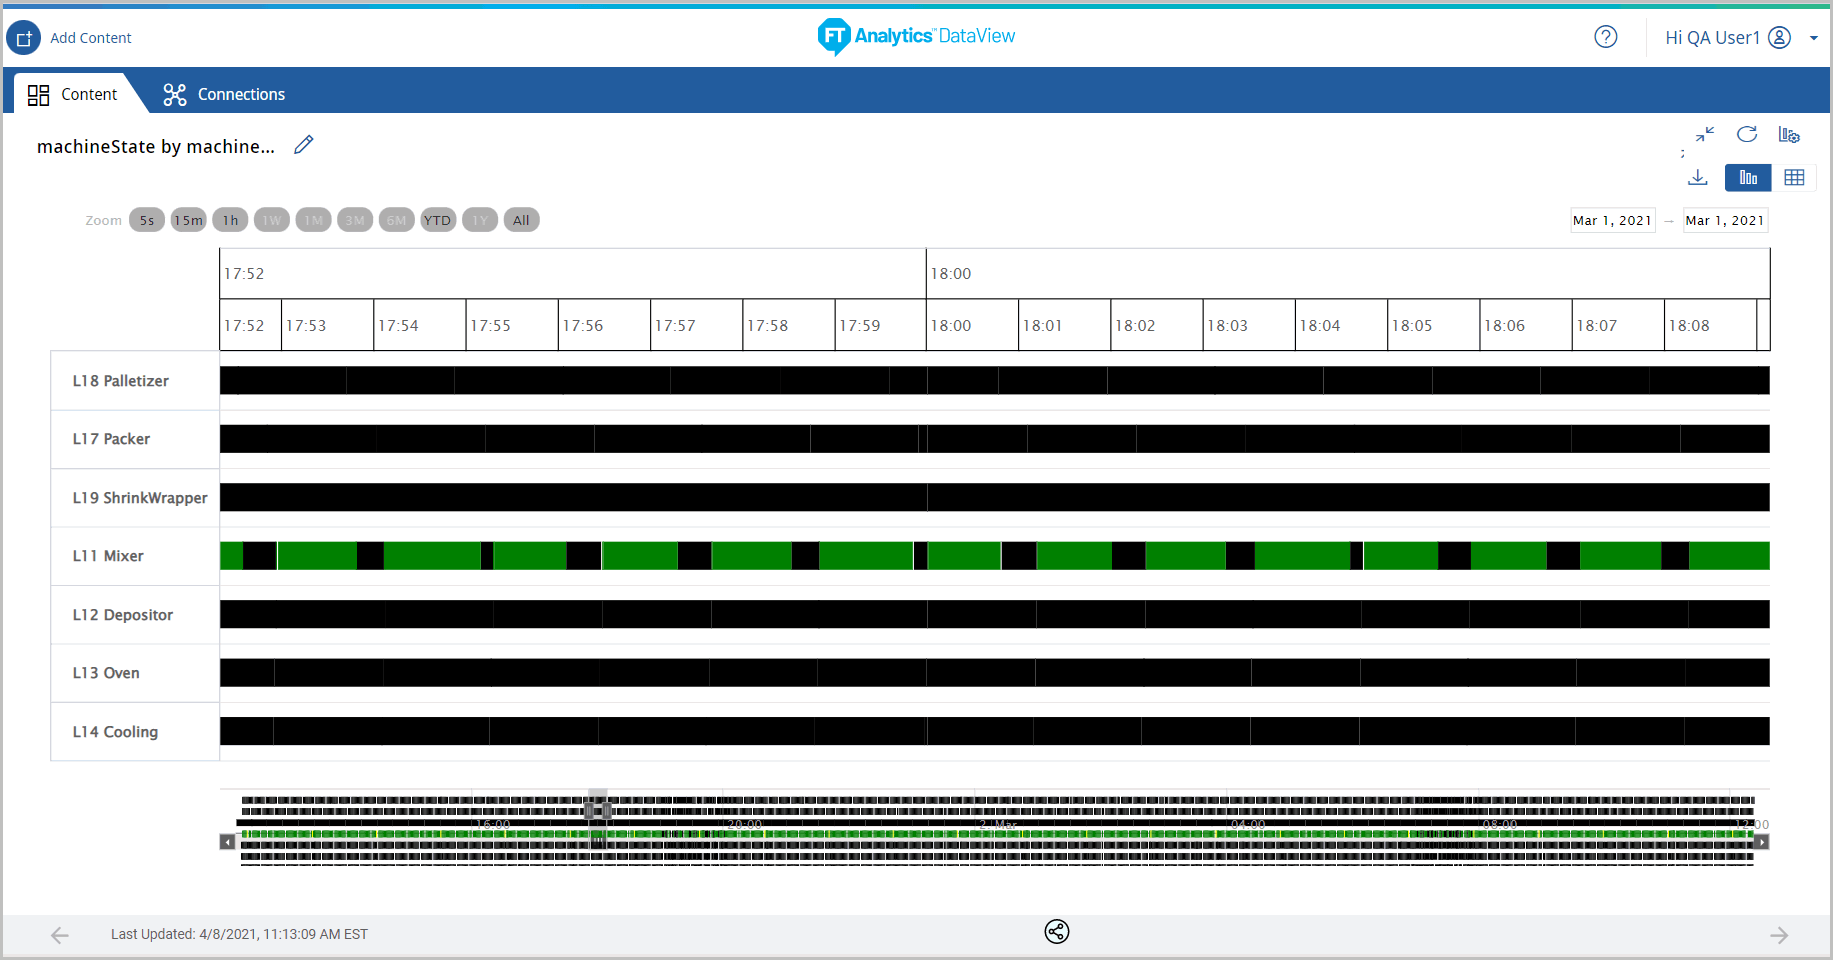
- The Chart Settings options are disabled for Gantt chart.Gantt Chart Settings
- Minimize the chart tile the Storyboard with updated chart tile displays.Storyboard Updated
- On the Gantt chart tile, click the [
 ] icon and then click [Duplicate] to clone the Gantt chart.IMPORTANT:User can create Gantt chart only by generating the Storyboard with the template or by cloning the Gantt chart tile.Clone Gantt Chart
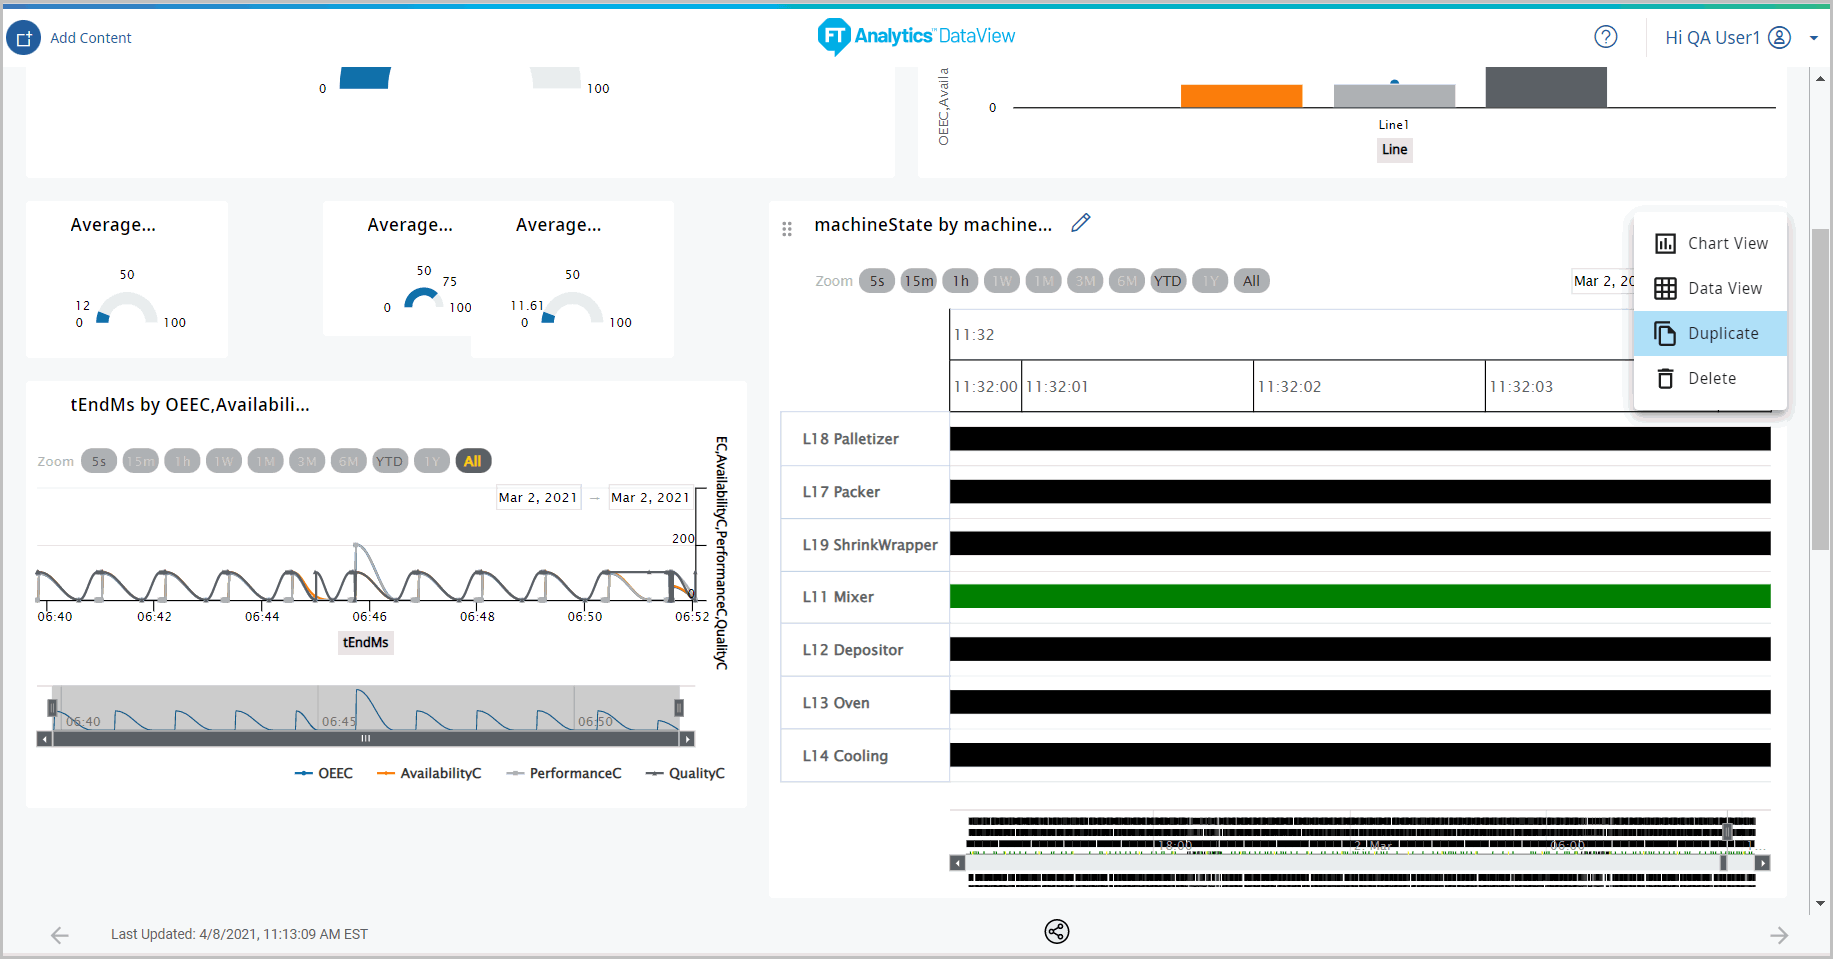
Provide Feedback