Metric Chart
- Open a Storyboard, hover the mouse on a chart tile and click the [
 ] icon to maximize the tile.
 - Click the [
 ] icon. The Chart Settings window displays.Attribute
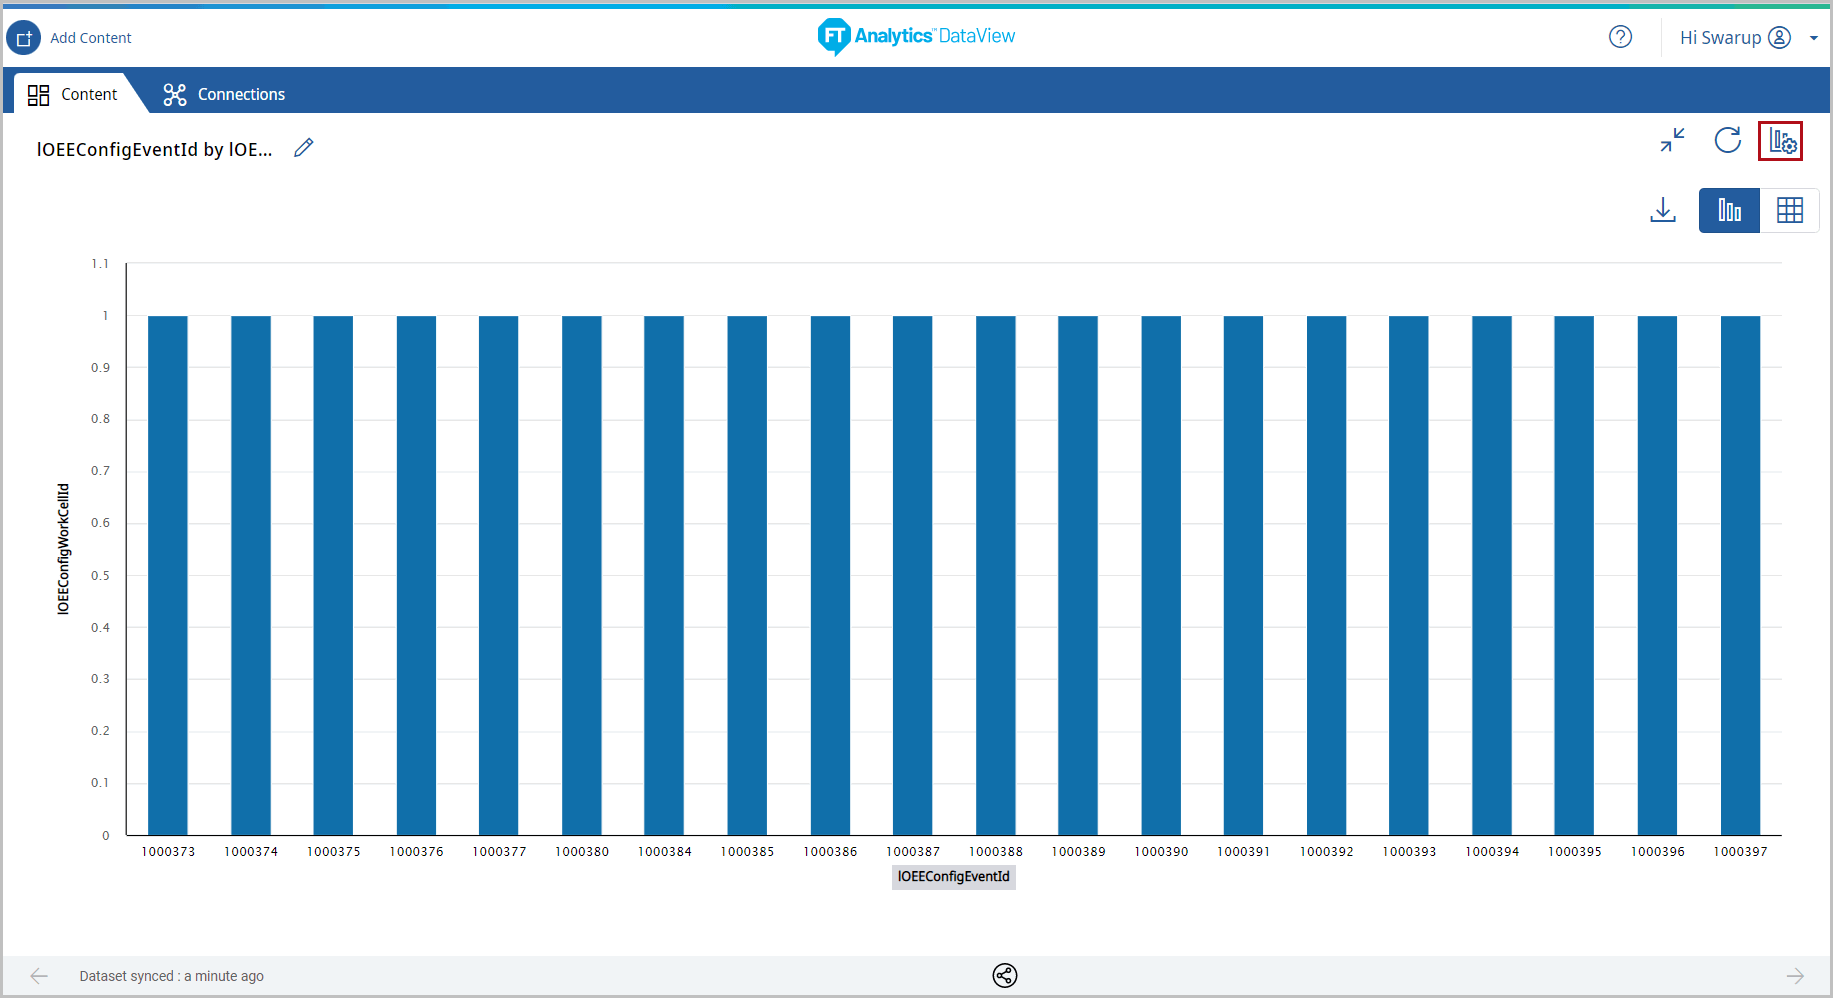 Under the Type tab, the list of available chart type displays.
 - Select the [123 Metric] chart from the Chart Type section.Chart Settings
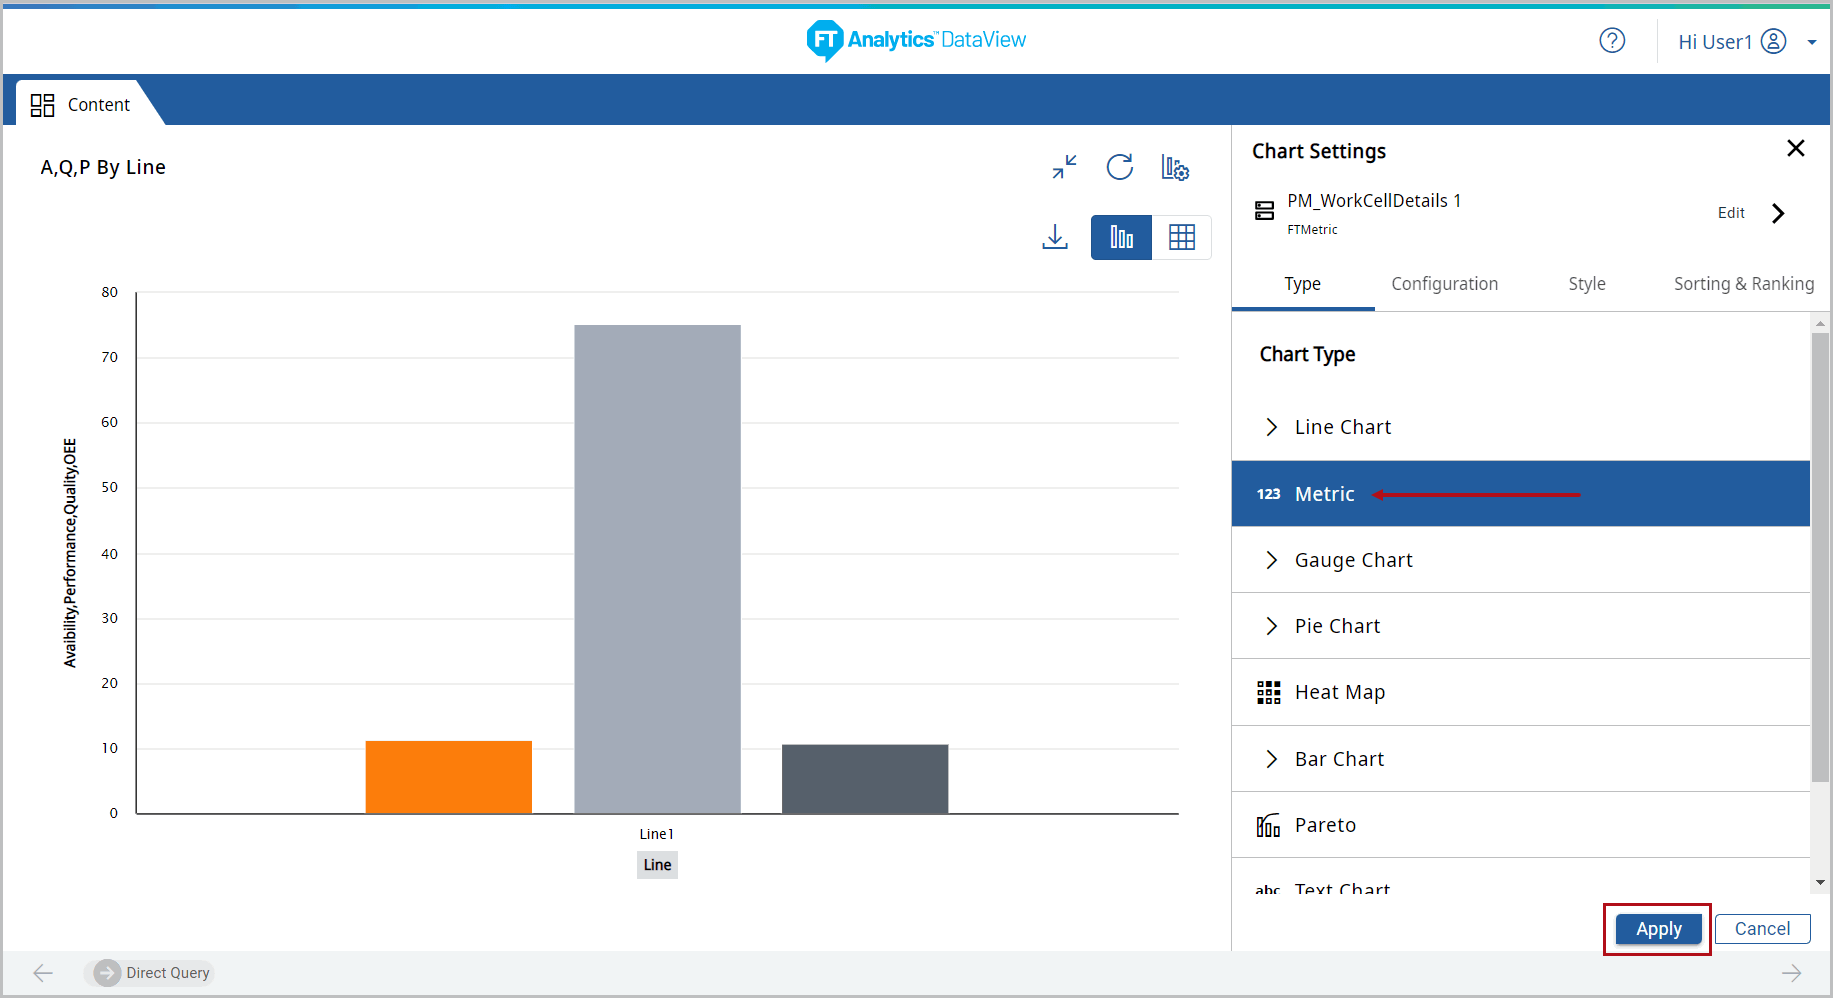
- Click [Apply]. The Metric chart displays.Metric Chart
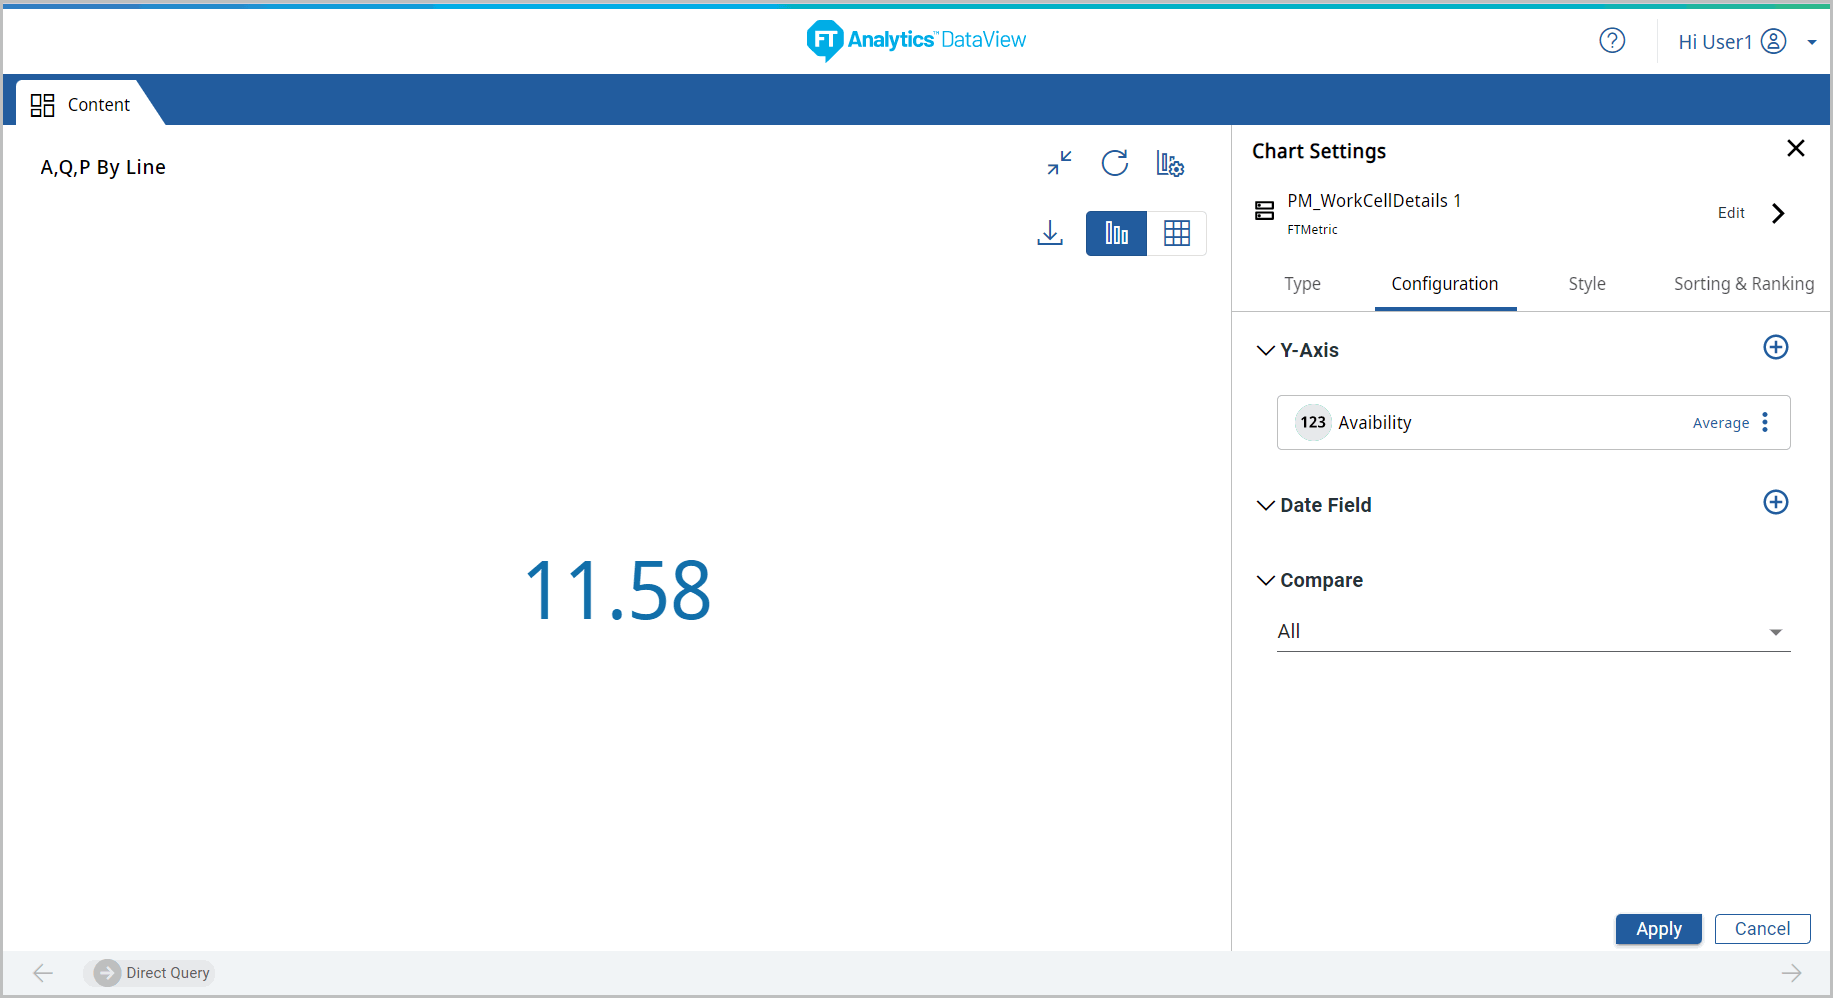
- Under the Configuration tab, provide the following properties:
- Y-Axis: Select the desired attribute.NOTE:This chart type does not support multiple Y-Axis values.
- Date Field: Select a desired date field from the drop-down list.
- Tooltip: User can select the values to be displayed on the tooltip.
- Under the Style tab, User can change the following:
- Chart Theme: Change the theme color.
- Chart Settings: Enable or disable Chart Tile option.Metric Chart - Configurations
 NOTE:This chart type does not support Sorting & Ranking options.Metric Chart - Configurations
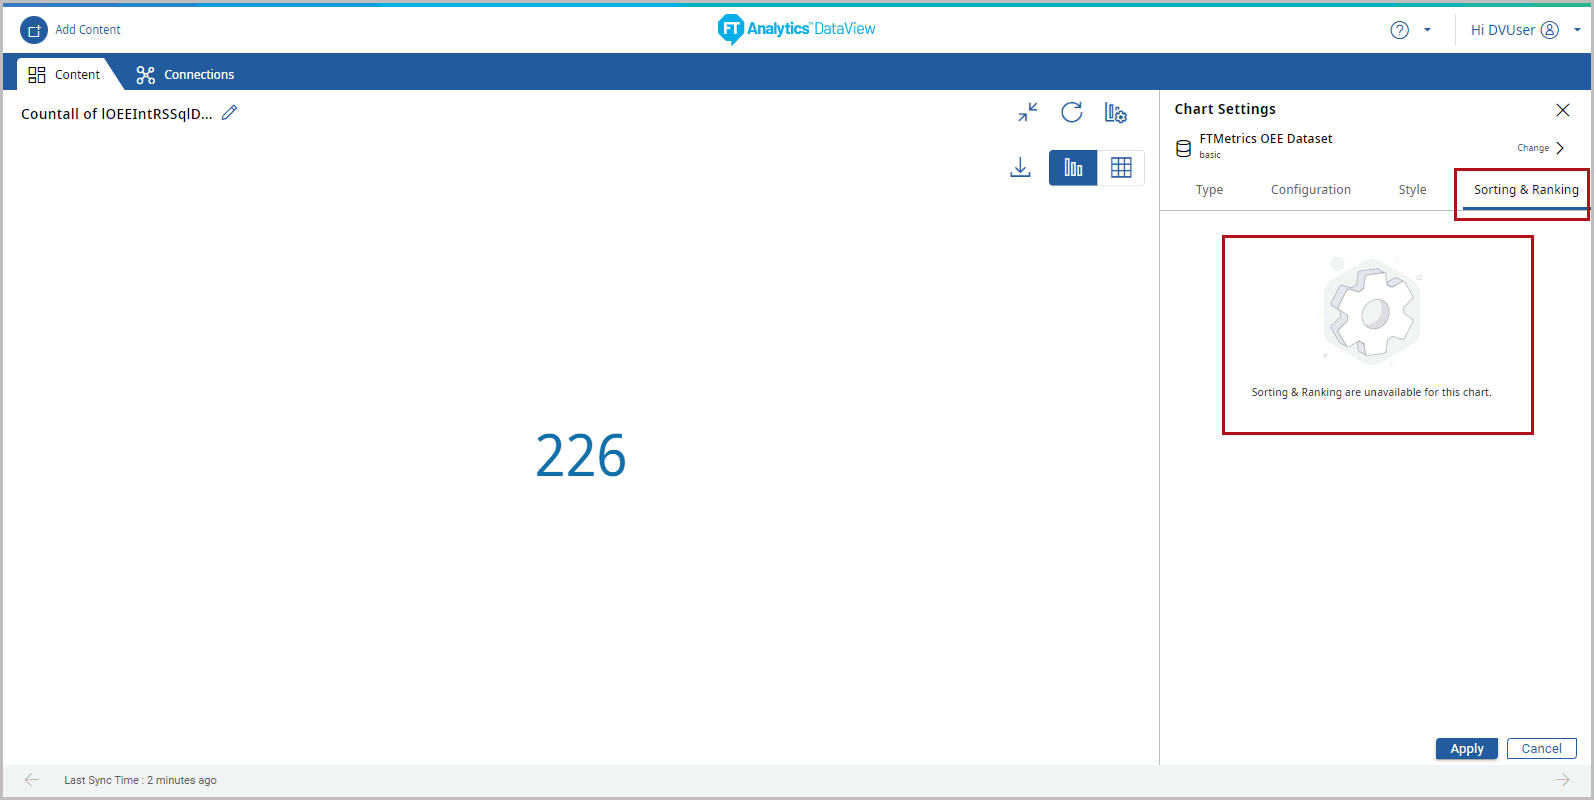
- Click the [
 ] icon to minimize the chart. The updated Storyboard displays.Storyboard Updated
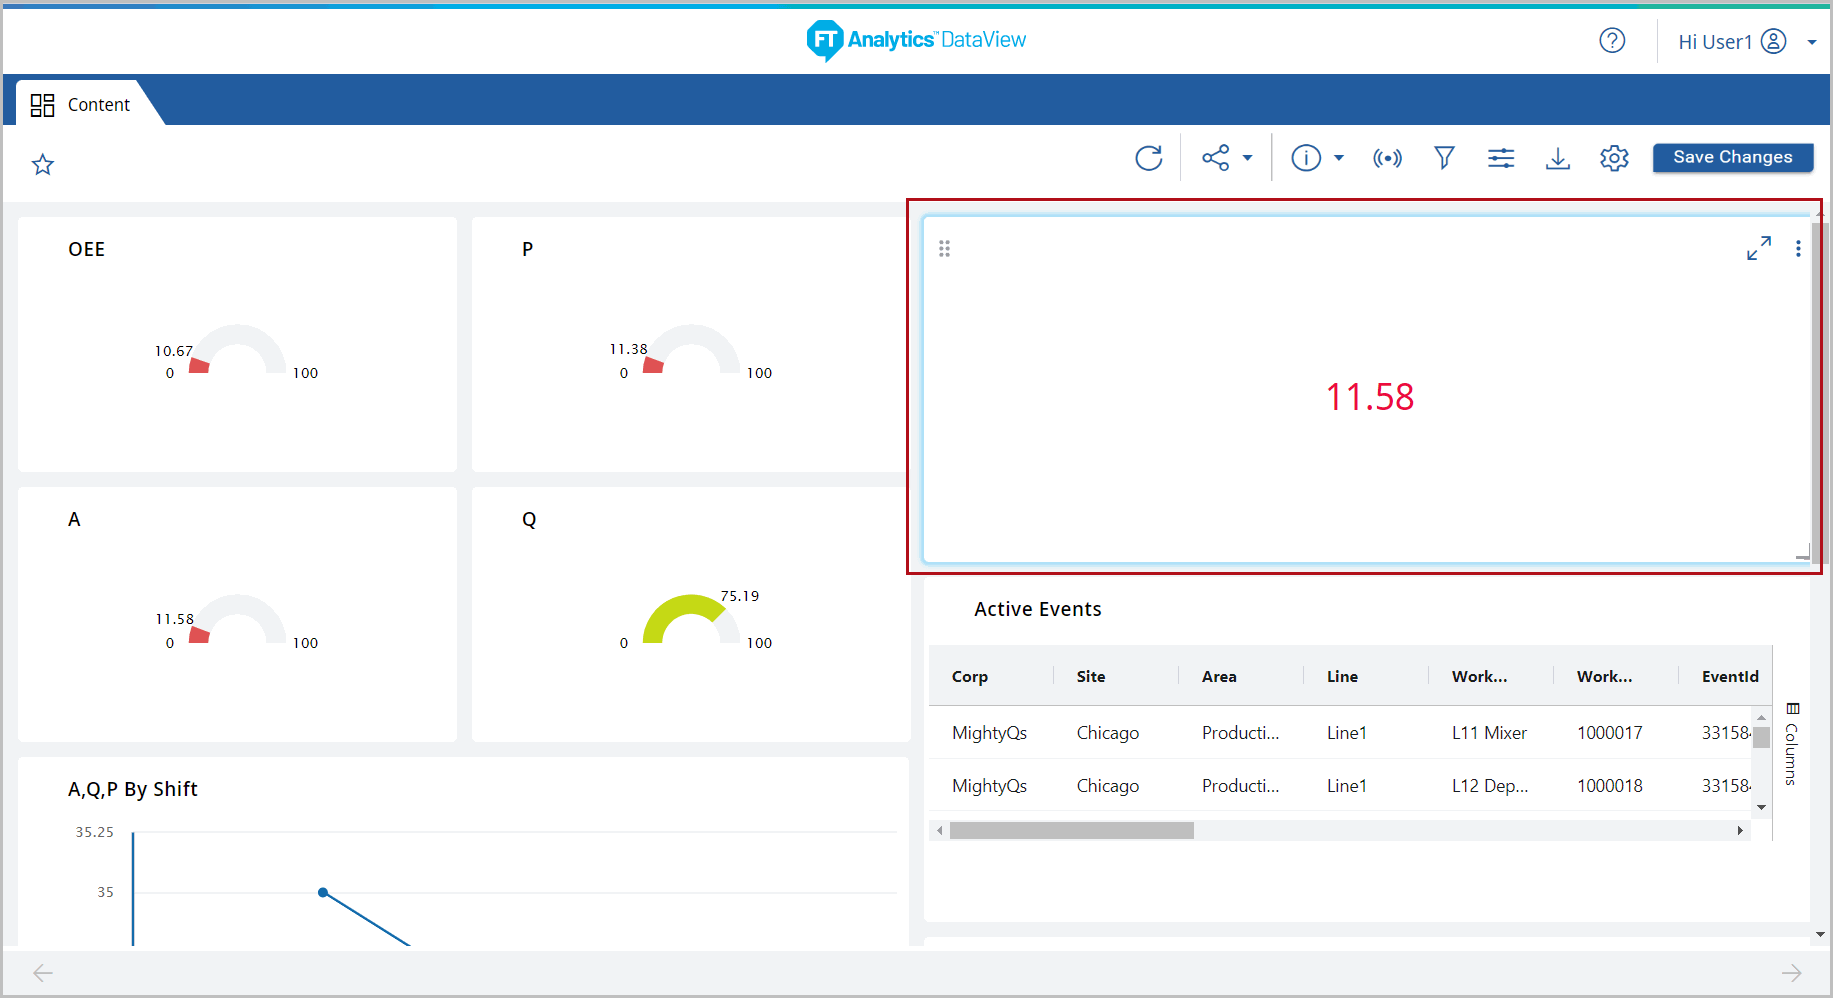
Provide Feedback