Drilldown
- Click on a data point of any chart, the Quick Access menu displays.Quick Access Menu
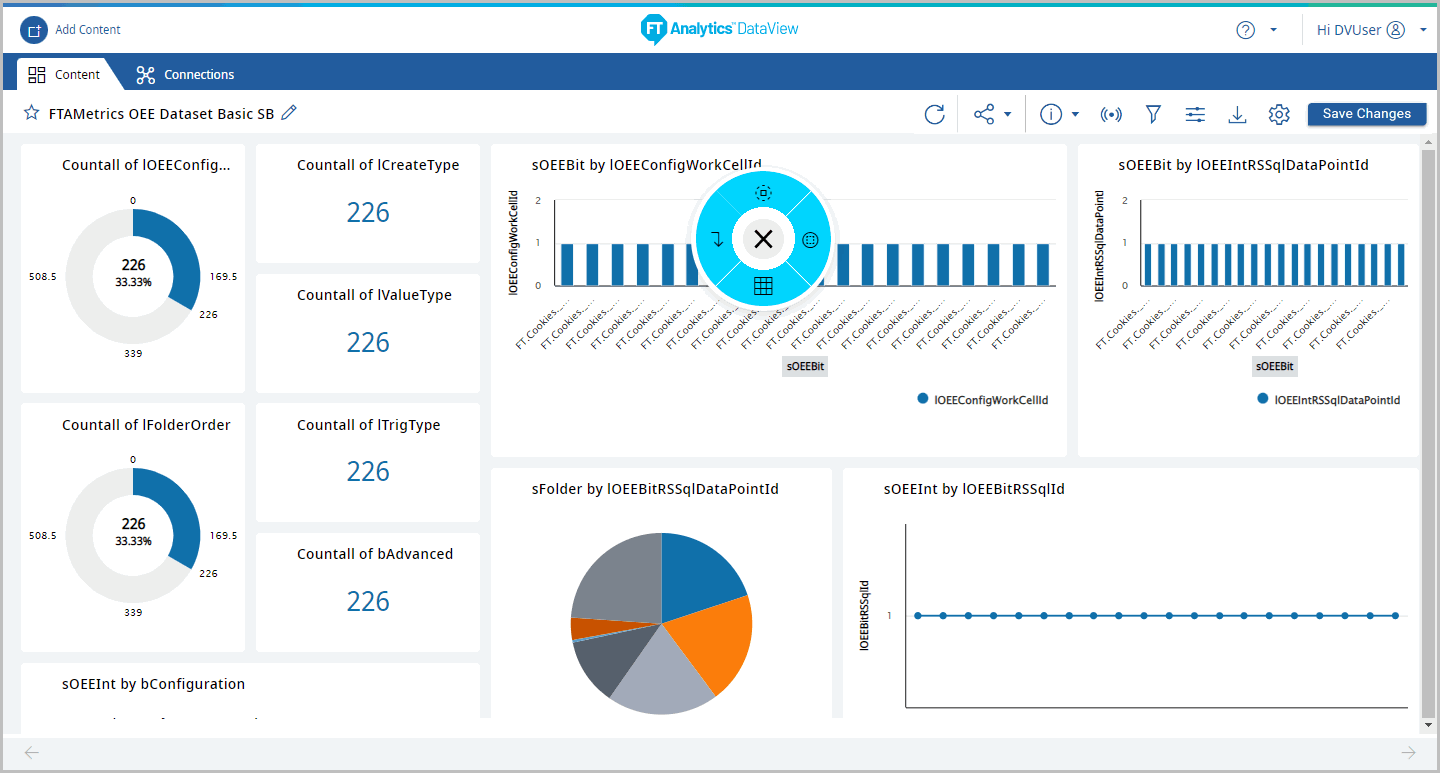
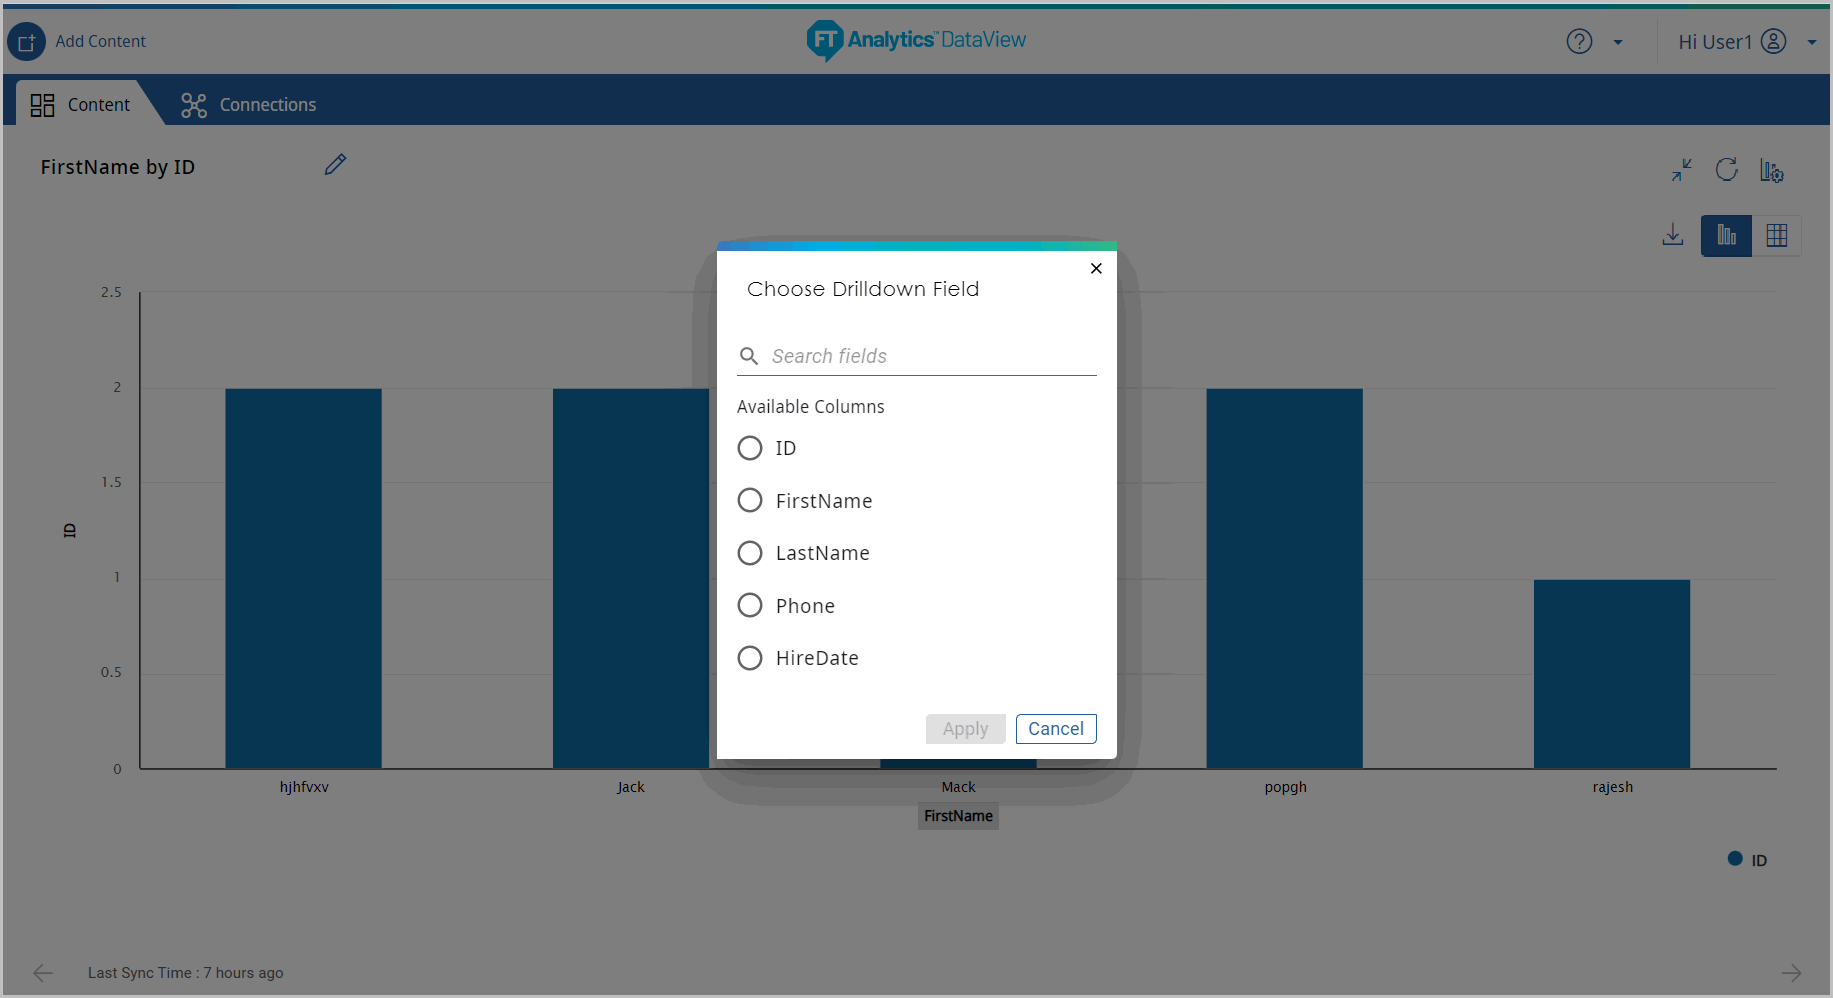
- Click the [
 ] icon, [Choose Drilldown Field] dialog displays.
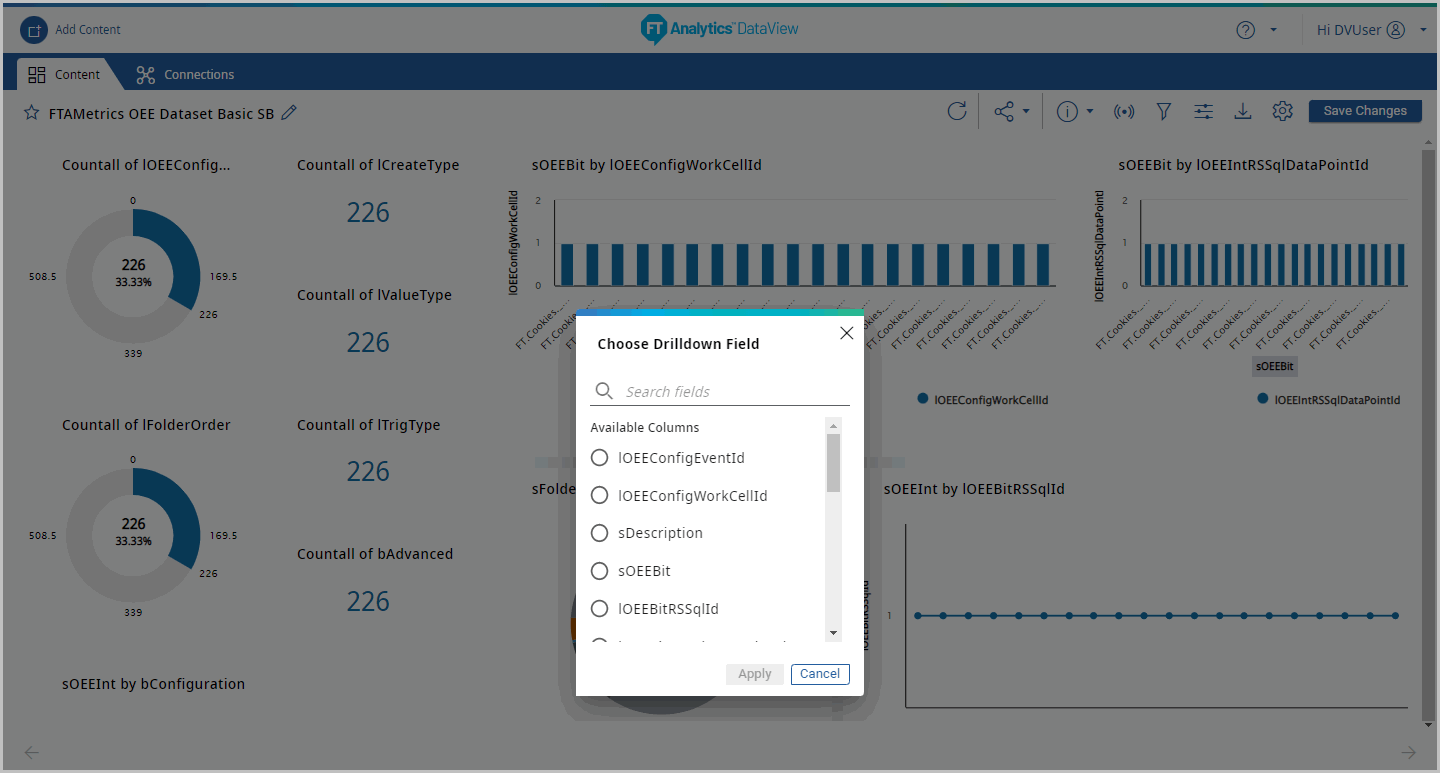
 - Select the drilldown column and click [Apply].NOTE:Once the ‘Keep Only’ filter is removed, refresh the page to apply the ‘Keep Only’ filter again to drilldown the chart data.Select columns
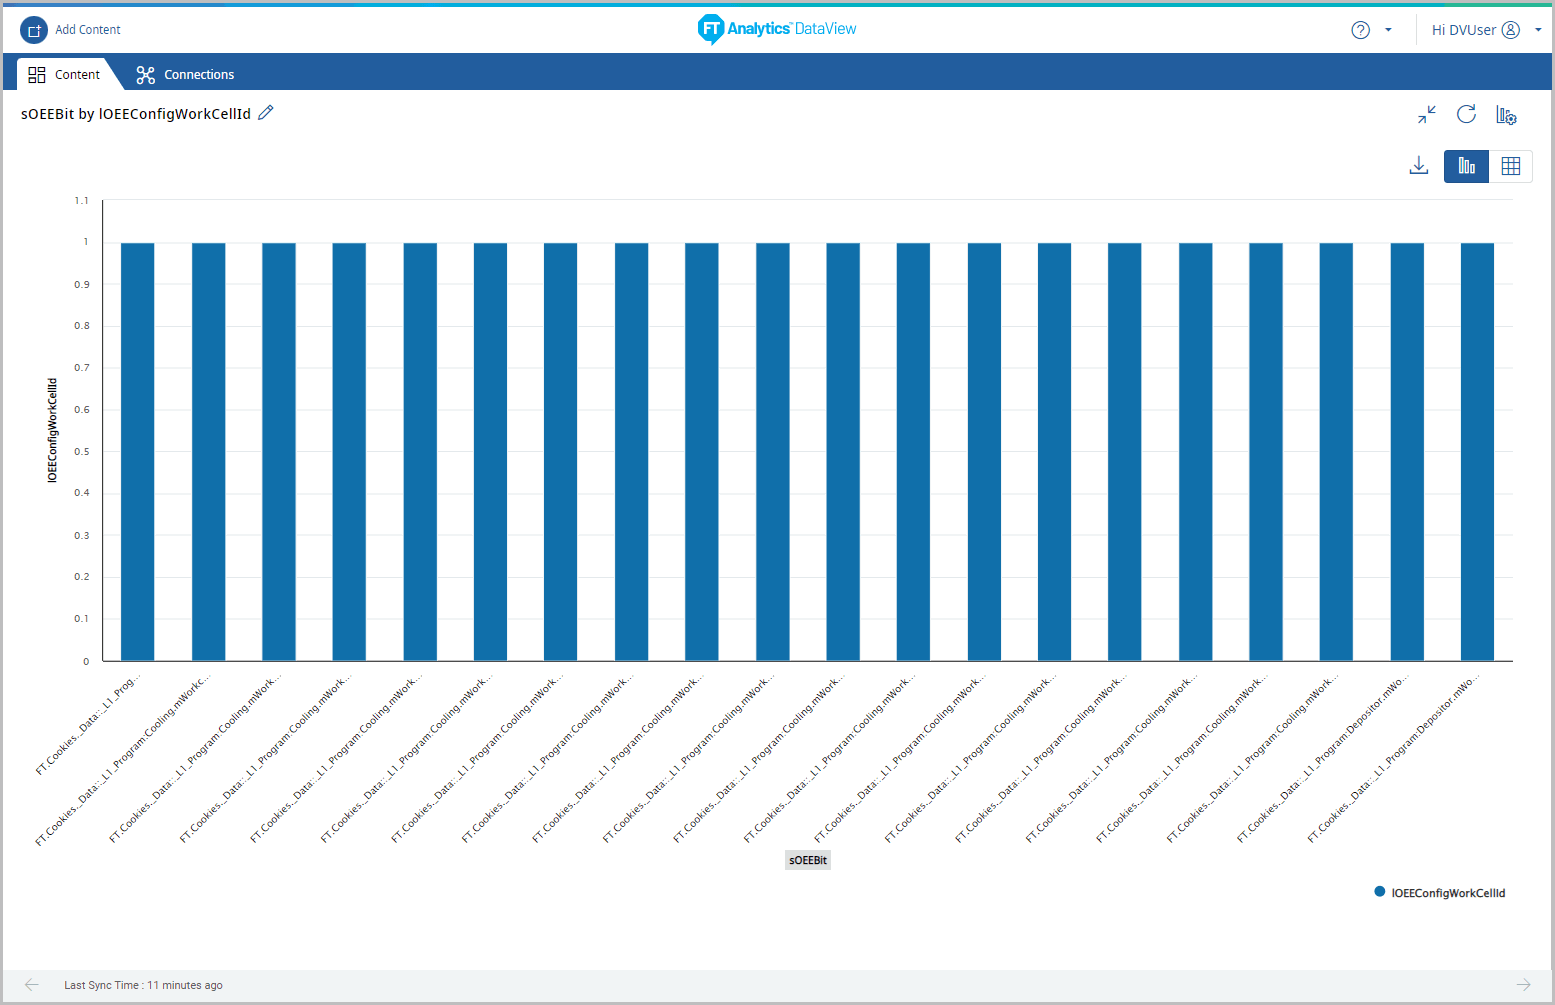
 The updated Storyboard displays.Storyboard
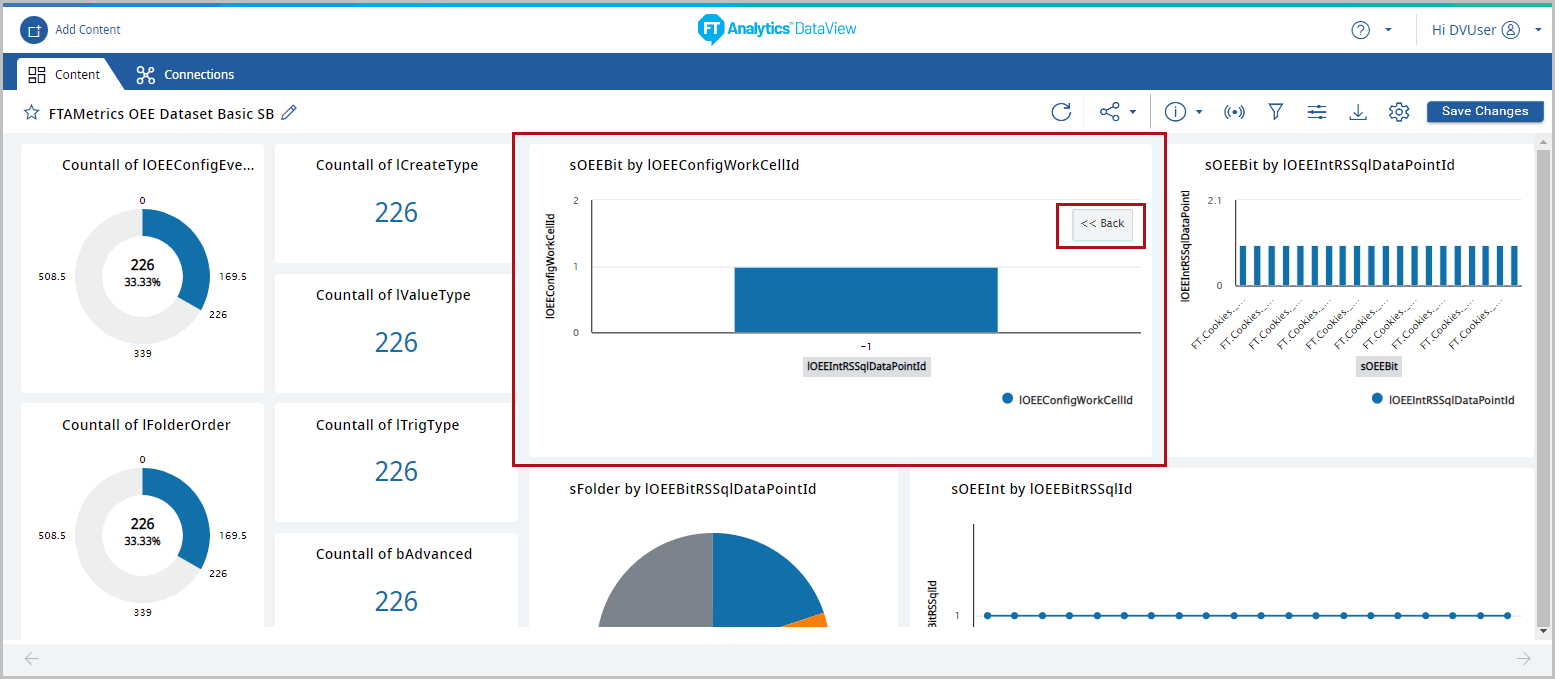 NOTE:When the Keep only instant filter is applied on columns with date values, the charts with the ‘No Data Available’ message display.
 - On the chart, click [Back] to reset the Storyboard.
Chart Drilldown
Enables the User to prioritize the columns from the available columns in the dataset.
- Expand a chart tile and click on any data point. The Data point Quick Access Menu displays.Quick Access Menu
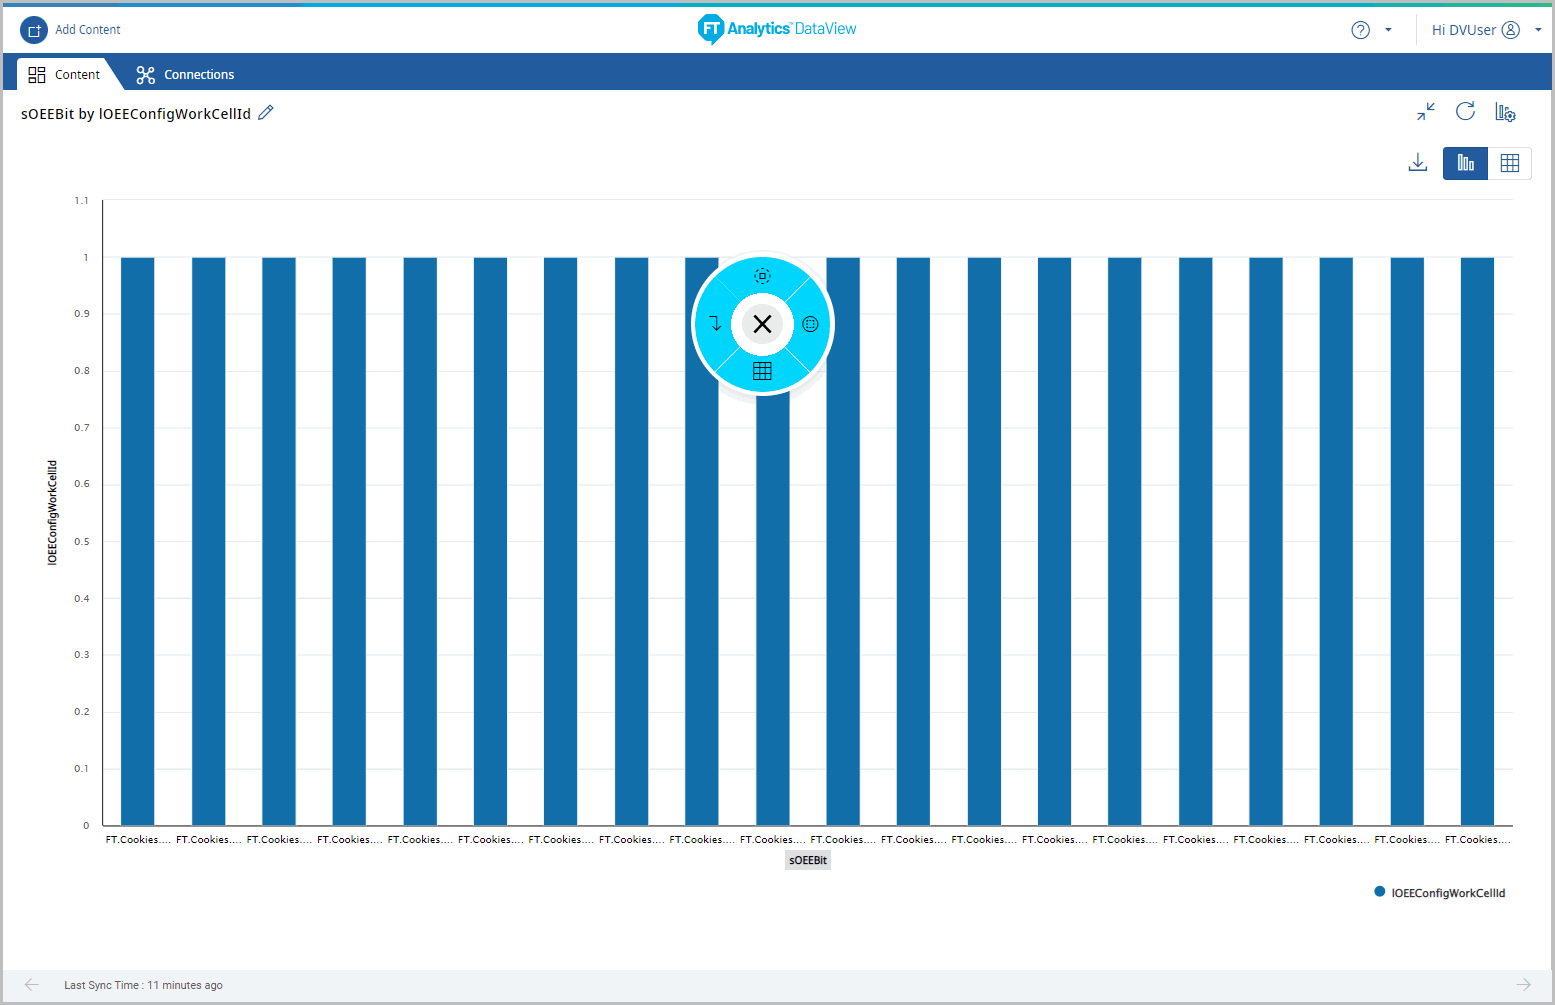
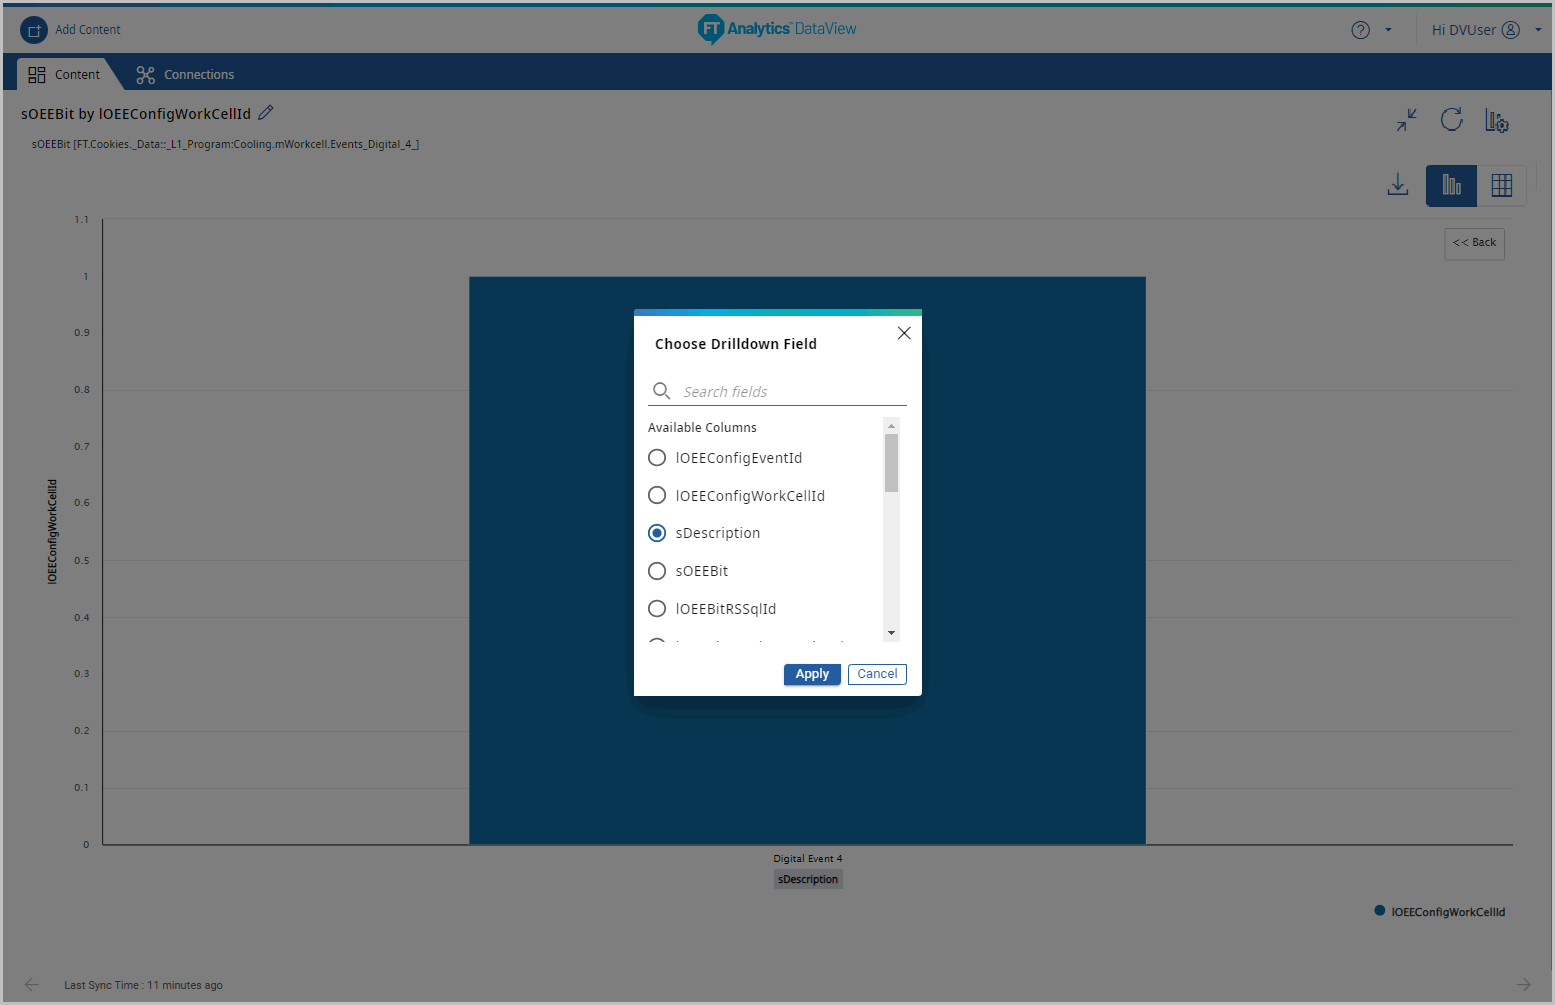
- Click the [] icon, the [Choose Drilldown Field] dialog displays the list of columns in the source dataset.
- Select the column to Drilldown and click [Apply].Chart - Drilldown Field
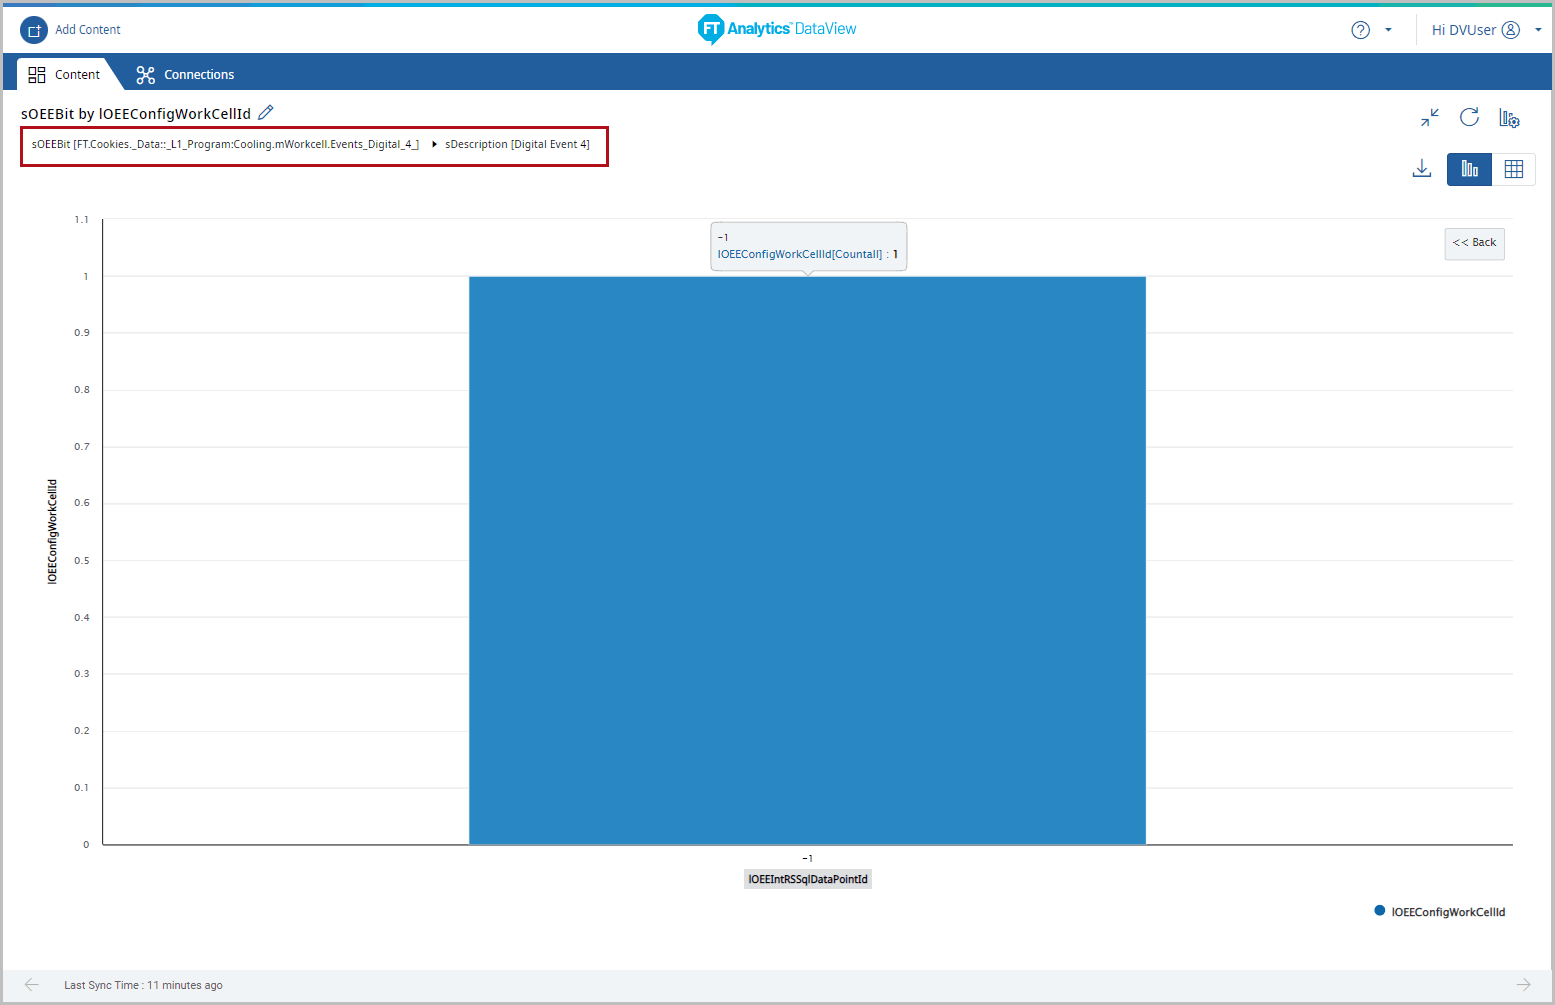
- The updated chart with drilldown column displays the breadcrumb for the drilldown column.TIP:The Drilldown with breadcrumb (for multiple levels) option is enabled only for the expanded Chart tile on a Storyboard.Updated Chart - Drilldown
- Click on the data point of a chart and select the desired column to further drilldown.Chart - Drilldown Field
- The updated chart displays the breadcrumb for multiple levels of drilldown.Chart - Drilldown Multiple Breadcrumb
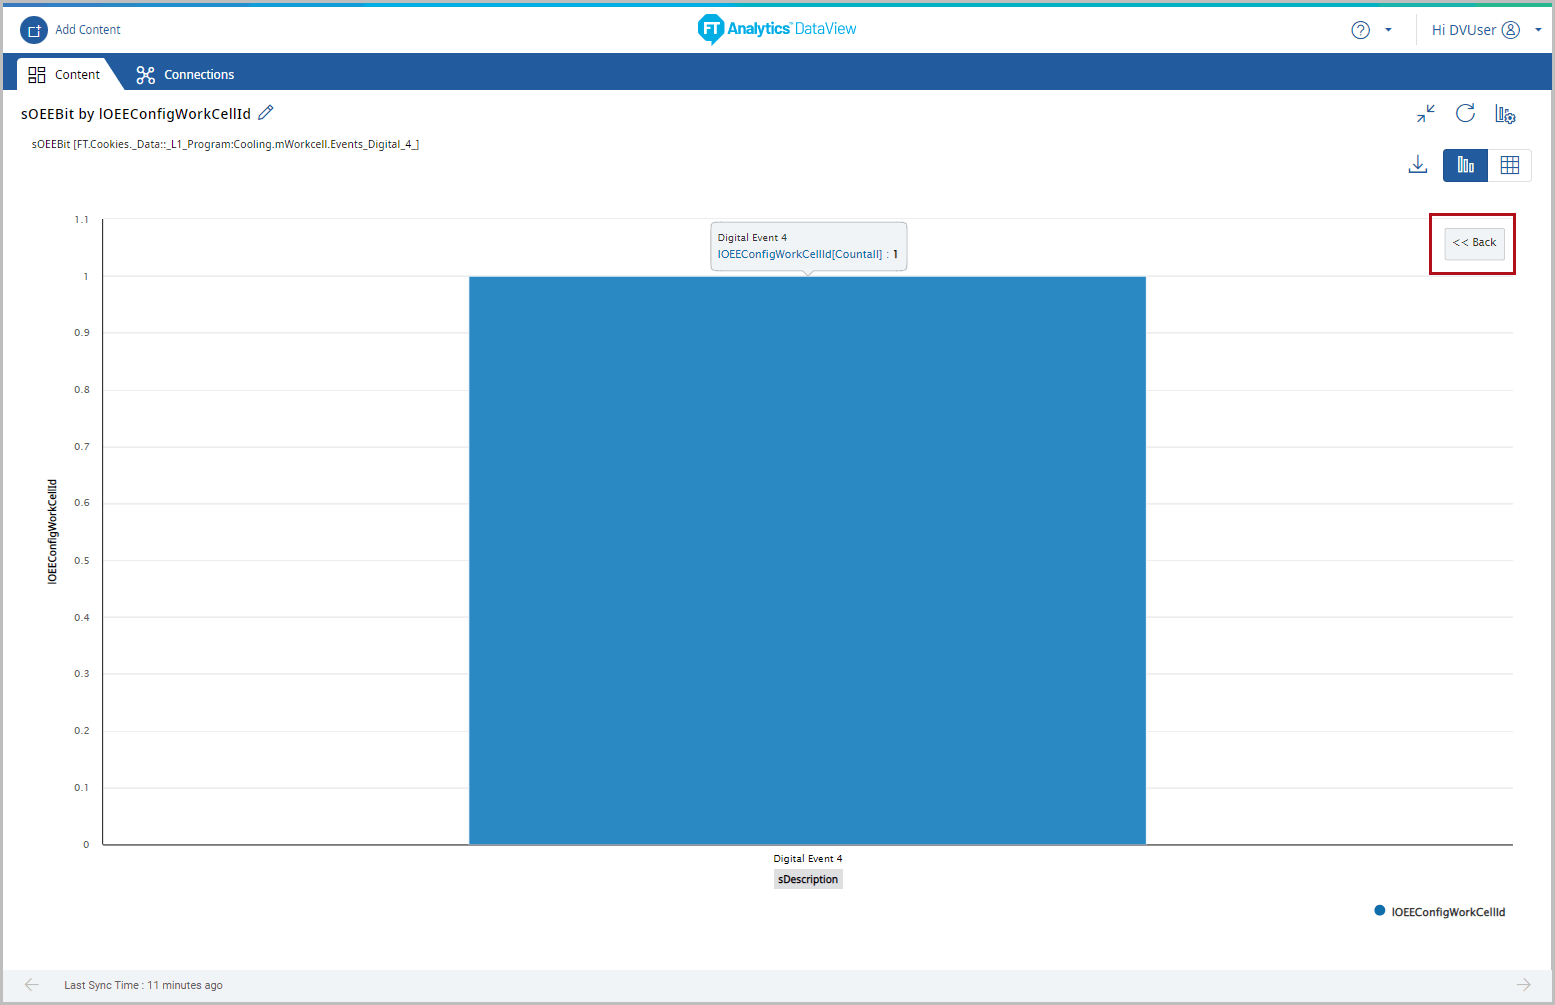
- Click [Back] to go back to the previous view of the chart(OR)Click the Refresh icon to remove the drilldown settings and reset the chart.Chart - Drilldown Refresh
Provide Feedback