Mapped Filters
Mapped filters option is available only for the Storyboards created with pre-configured templates. Allows User to apply filter with more than one column from multiple datasets.
Example: For Mapped filter if Shift column is selected it applies to the dataset1.shift, dataset2.shiftname columns in different datasets.
- On the Storyboard, click the [
 ] icon.Pre-configured Storyboard - Filter
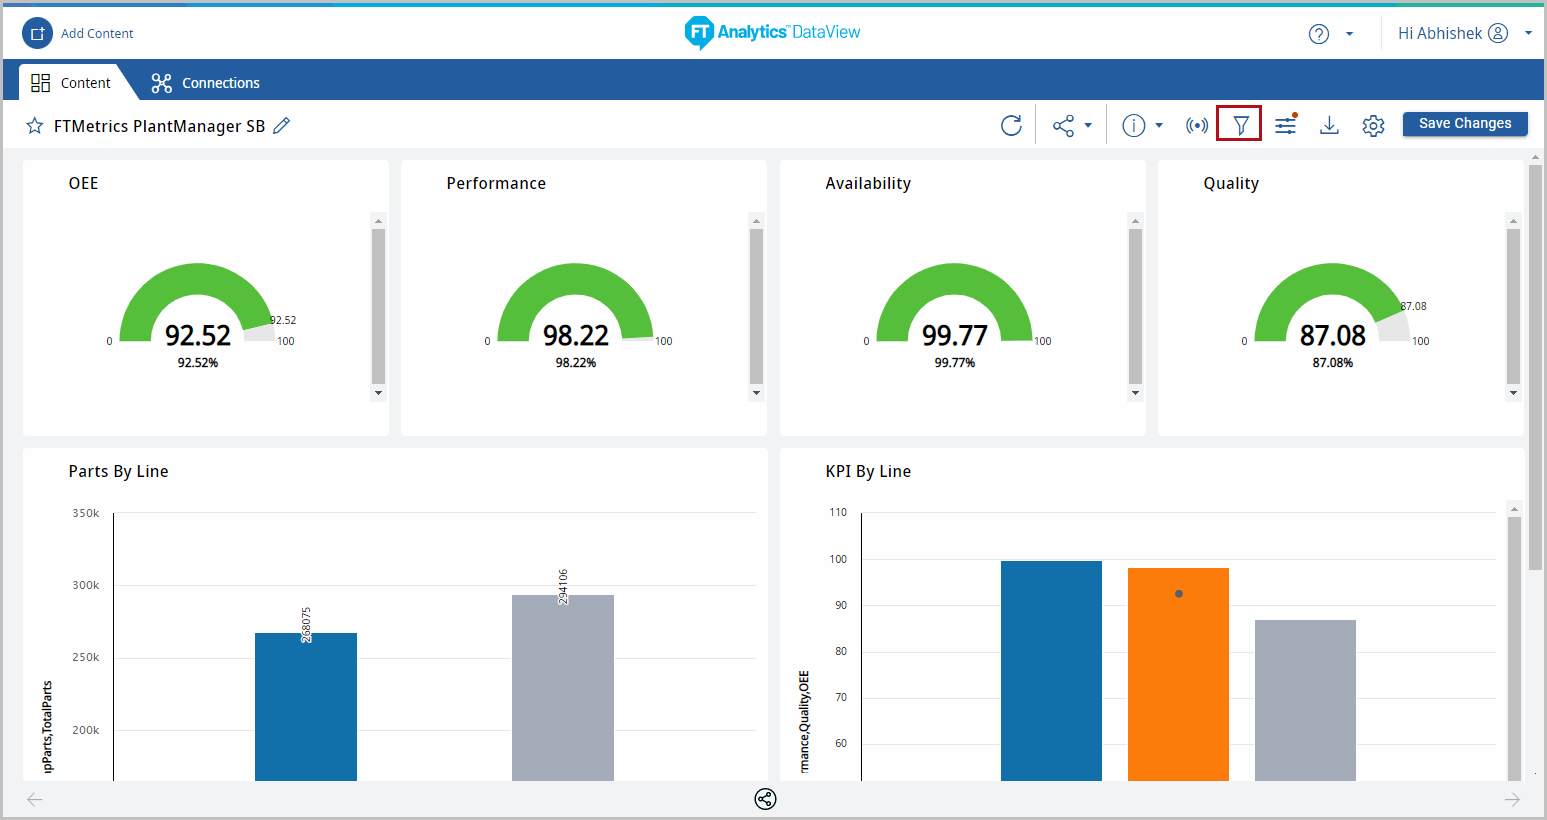 The Filter window displays.
 - Click [Add Filters] and the Choose a Filter dialog displays.
- Under Column Mapping section select the required columns and click [Next].NOTE:Mapped filter does not have Numeric field in Column Mappings.Select Column Mappings
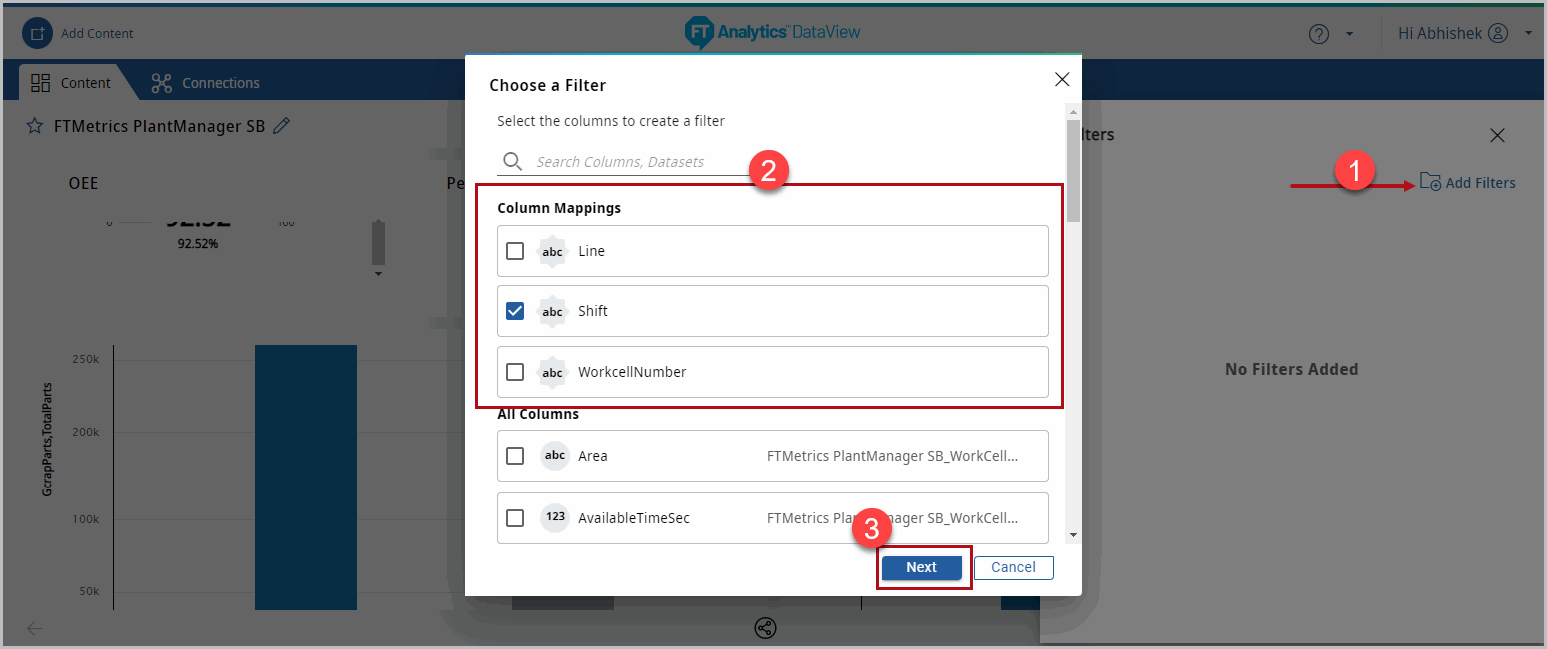 NOTE:User can select multiple columns for Column Mapping. If the selected columns have a large data, it takes time to load the page.
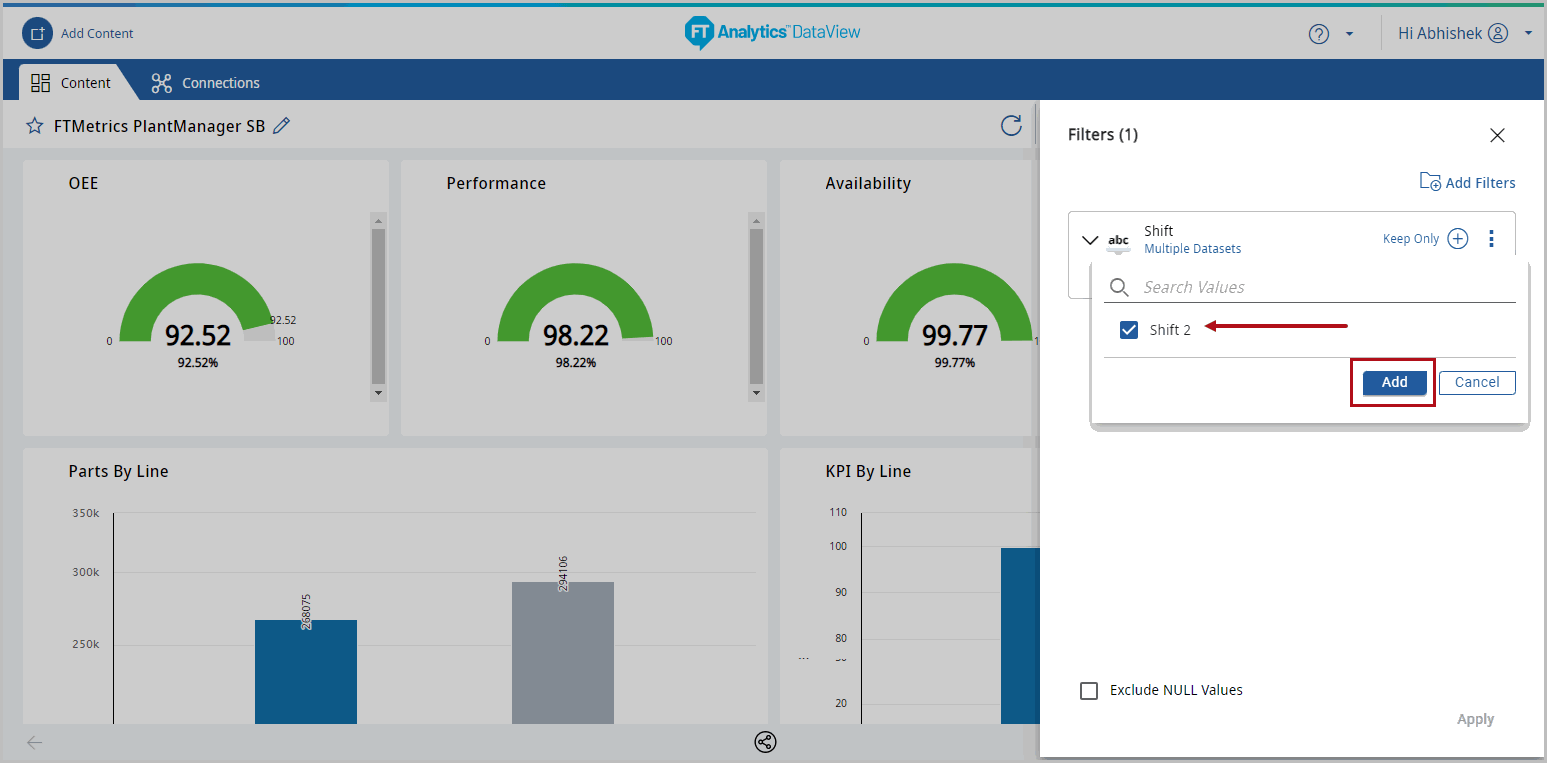
 - Click the [
 ] icon and select the columns to apply filters.
 - Click [Add].Add Mapped Filter
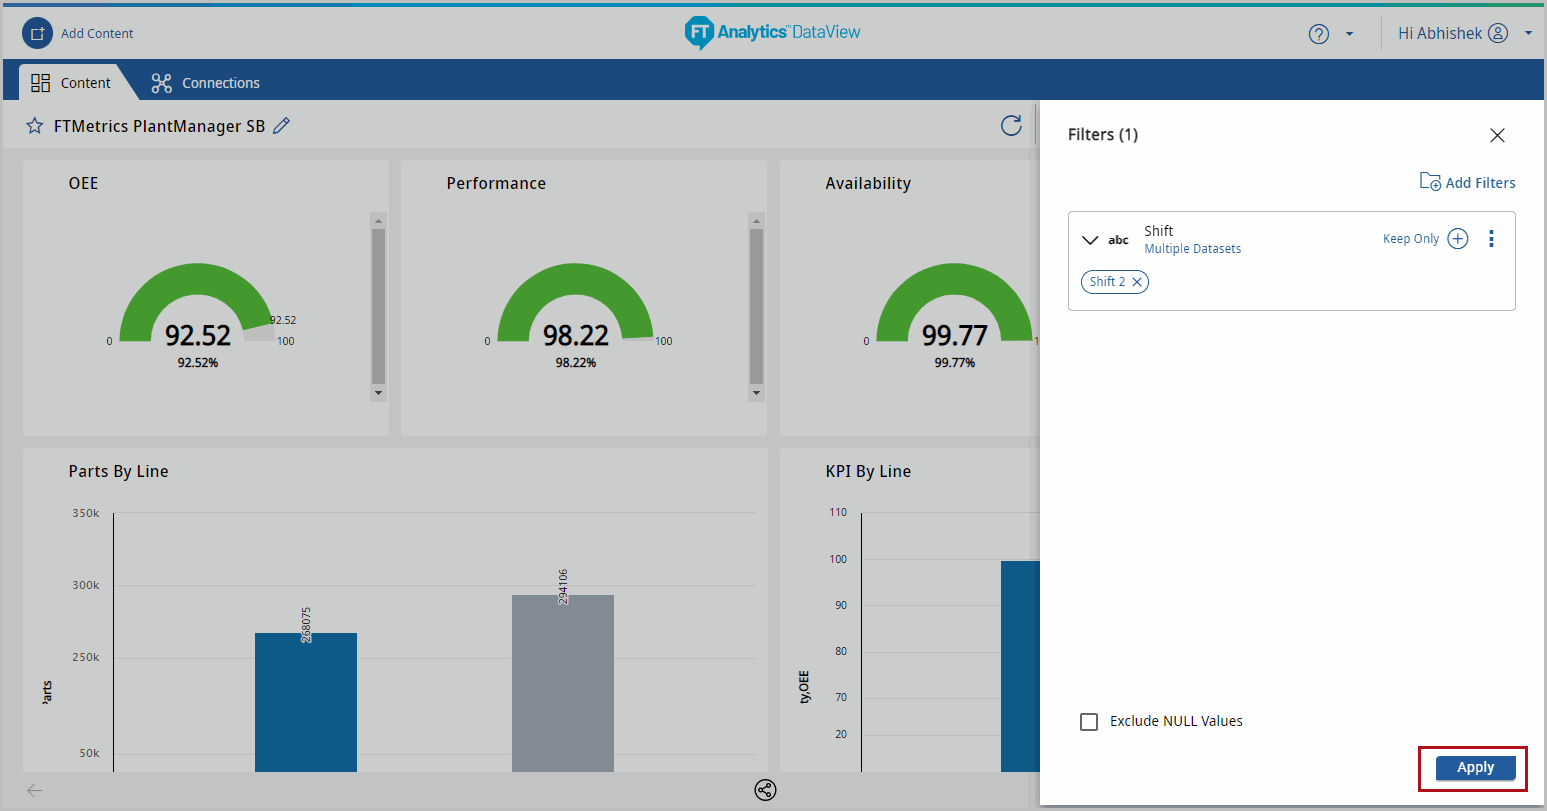
 NOTE:The [Apply] option is enabled only when the new columns are added, or existing columns modified in order to apply filter. Once the filter is applied, the [Apply] option is disabled.
 - Click [Apply].Apply Mapped Filter
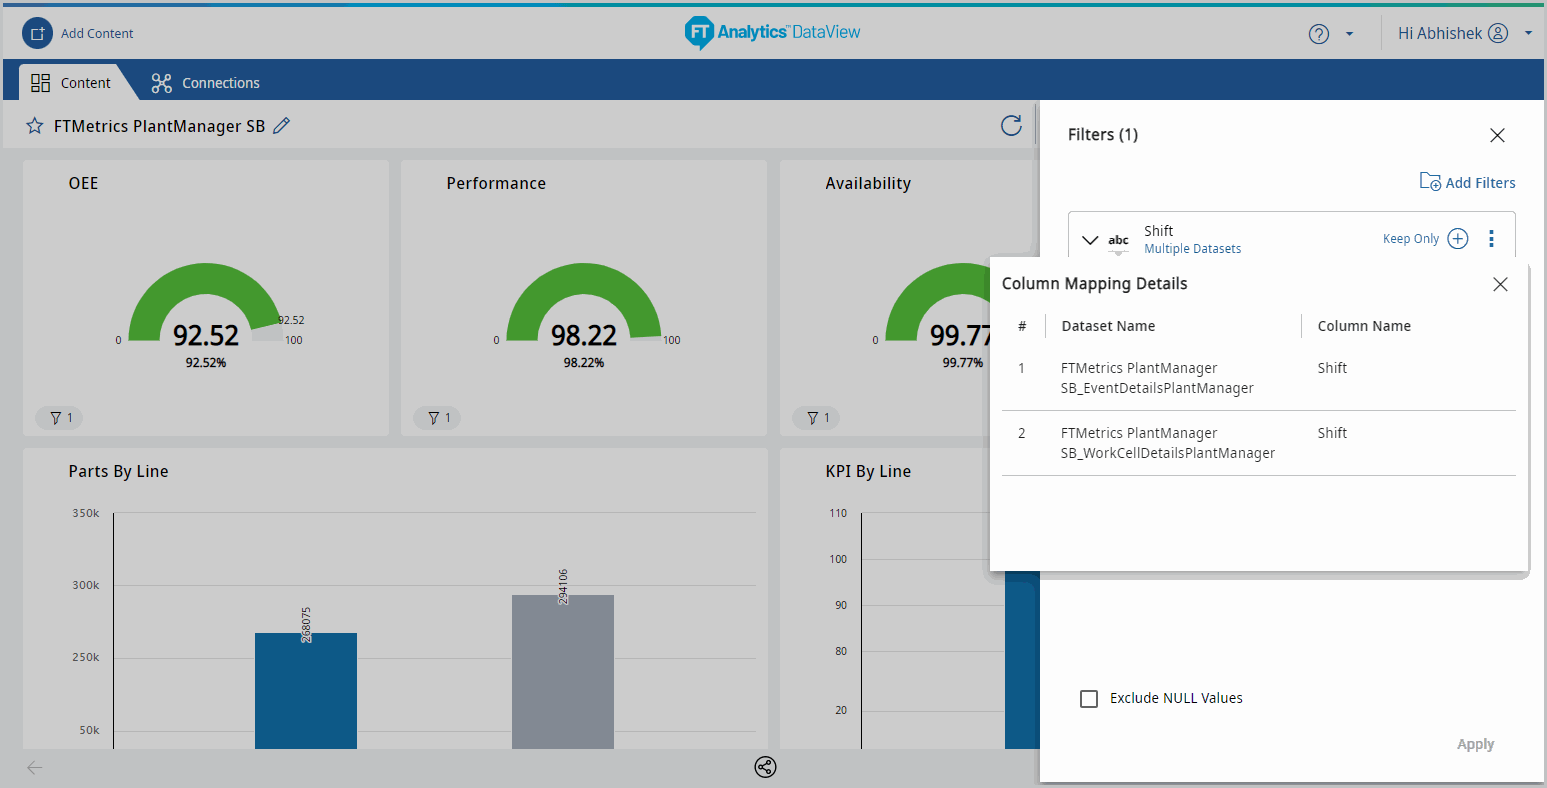
- Click [Multiple Datasets] to view the column Mapping details.Column Mapping Details
- Click the [
 ] icon to close the Filters window.The Storyboard with applied Filters display.Updated Storyboard - Mapped Filter
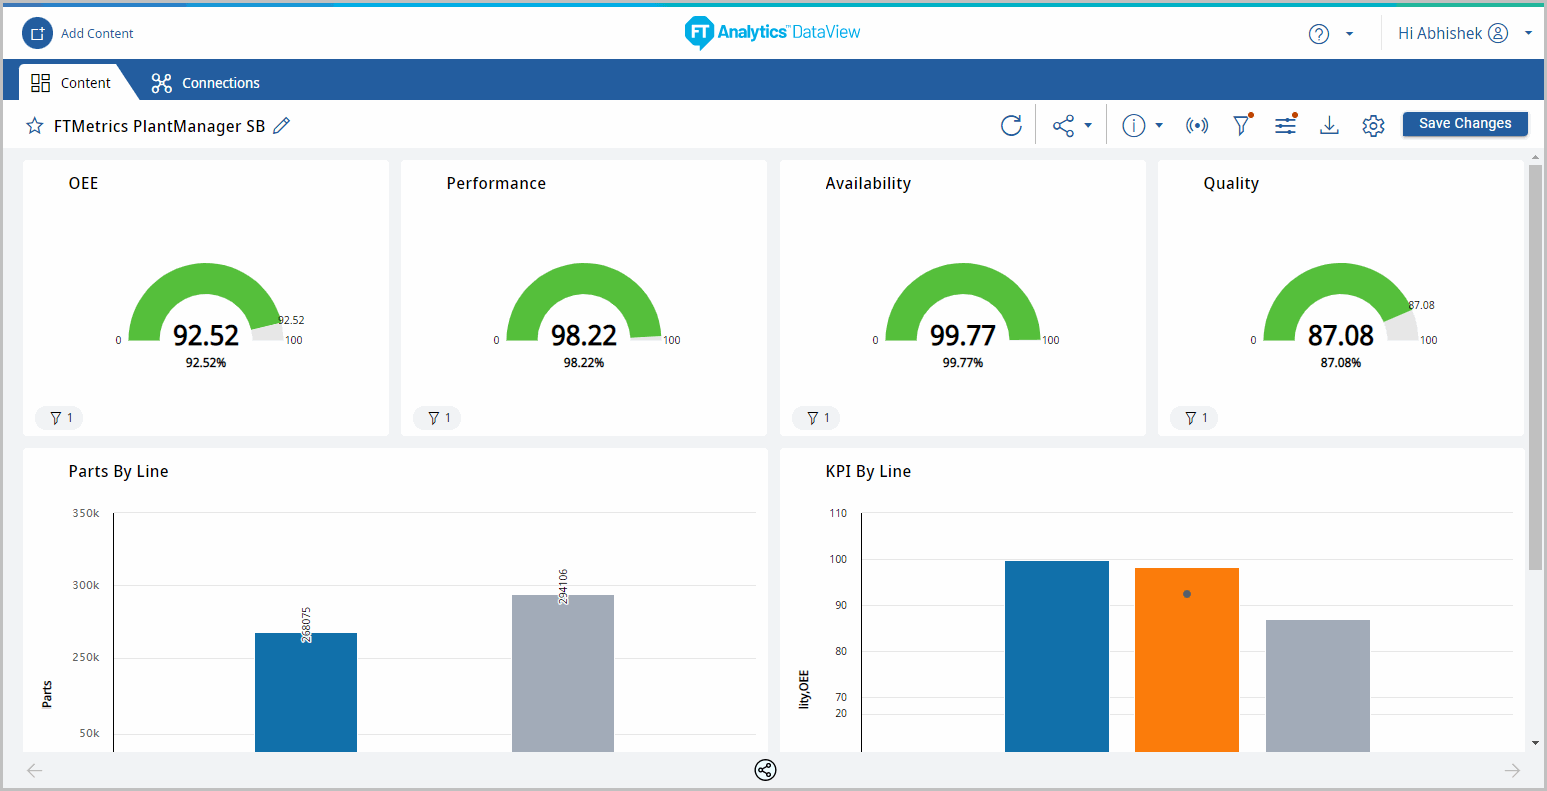
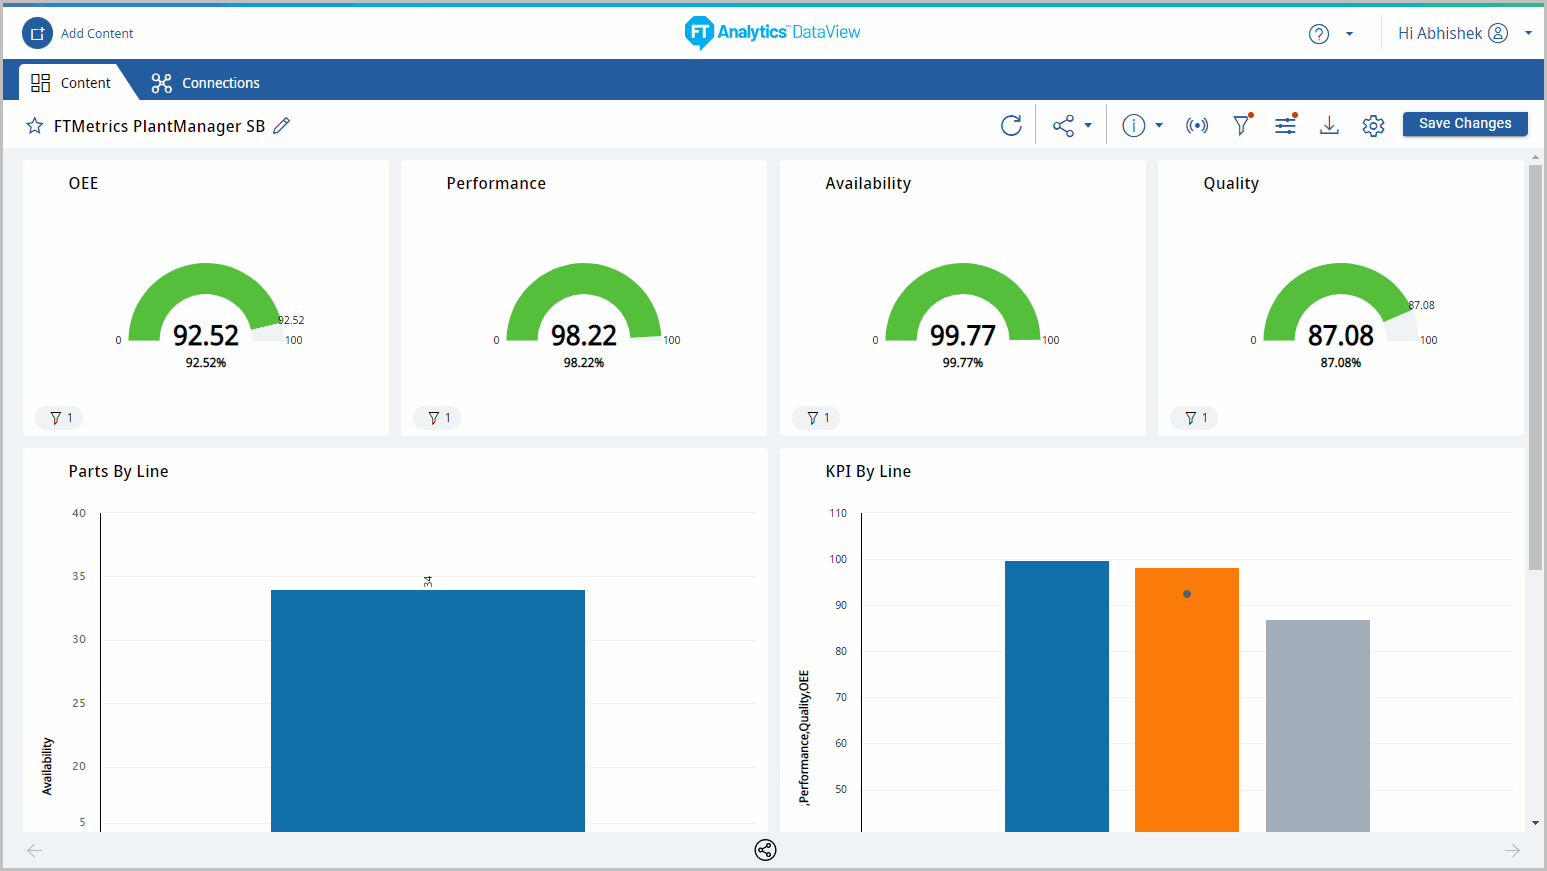
- When the User changes the dataset for any chart tile the Mapped filter on the chart is updated.Mapped Filters - Storyboard with Updated Dataset
- Click [Save Changes] to save the Storyboard with the applied Mapped filters.
Provide Feedback