Delay Correlation
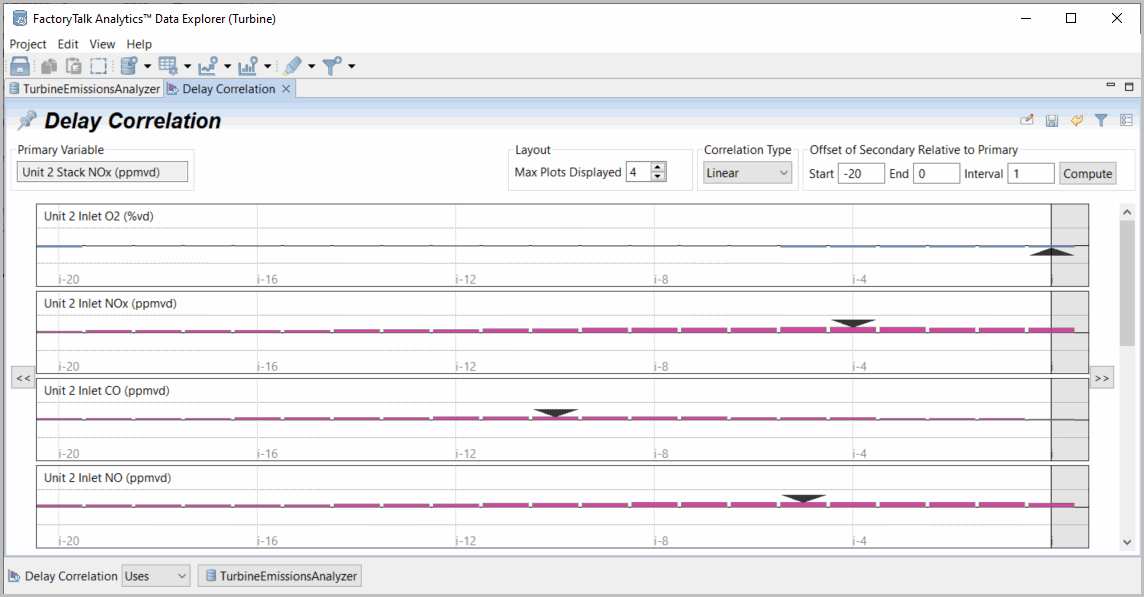
Delay Correlation focuses only on the relative delay between two or more variables. The default is minus 20 rows with a step size of 1 row. This can be edited once the initial search plot is reviewed. Once again, red is positive correlation, blue is negative correlation, and the size of each vertical bar is the correlation coefficient between 0 and 1 (or 0 and -1). The maximum displayed absolute coefficient is presented with a black arrow identifying it. A nonlinear correlation option can be helpful and the better strategy for identifying that actual delay.
Delay Correlation
Provide Feedback