Statistics
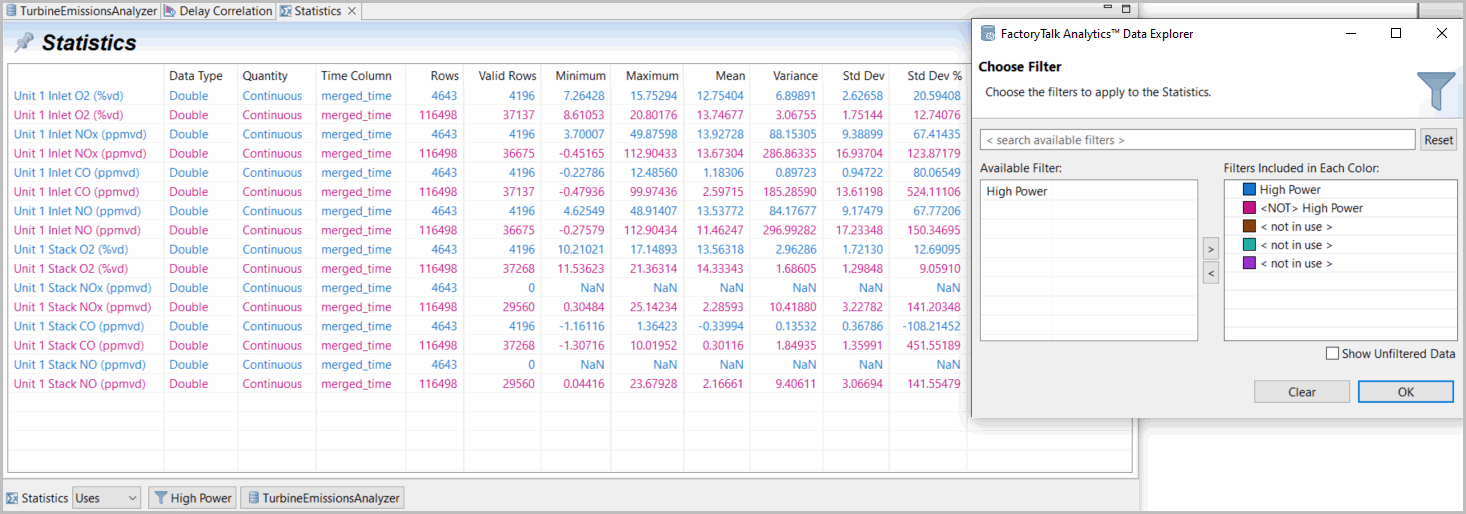
Use the statistics tool to view various measurements for the data item such as its number of valid rows compared to the total number of rows and the statistics for the item (minimum/maximum range, mean, standard deviation, etc.).
The view provided by the statistics tool is like the Value Statistics tab in that the same metrics are shown. However, the Value Statistics tab summarizes all the rows in the dataset whereas this analysis tools considers the set of filters applied.
There is no explicit button to re-perform the computation, but the statistics tool displays a selected variable list (as opposed to the manifest) and can be beneficially used to display or compare different filtered data groups. You can change the filter definition or the transforms contributing to the variables. The table refreshes itself based on re-computing all the statistics based on changes such as adjusting the presented filters.
The advanced statistics option (....) is available here as well. And the number of significant digits presented is a Preference setting. Finally the task menu, Edit, Copy option enables easily copying a statistical analysis to a report or EXCEL.
Statistics
Provide Feedback