Analysis Tab
A set of useful visual tools are available to provide model insights toward providing model explainability including model accuracy (in two formats), model feature sensitivity (in three formats) and model response surface. Analysis functions not only support model explainability, but using explainable images model validation or evaluation is supported along with a variety of functions to improve model results (by eliminating insignificant features, evaluating dataset regions where model match is less accurate or identifying dataset measurements strongly correlated with modelled residuals or error).
Note as with model training, filters may be useful and applied on model analyses.
Analysis Tab
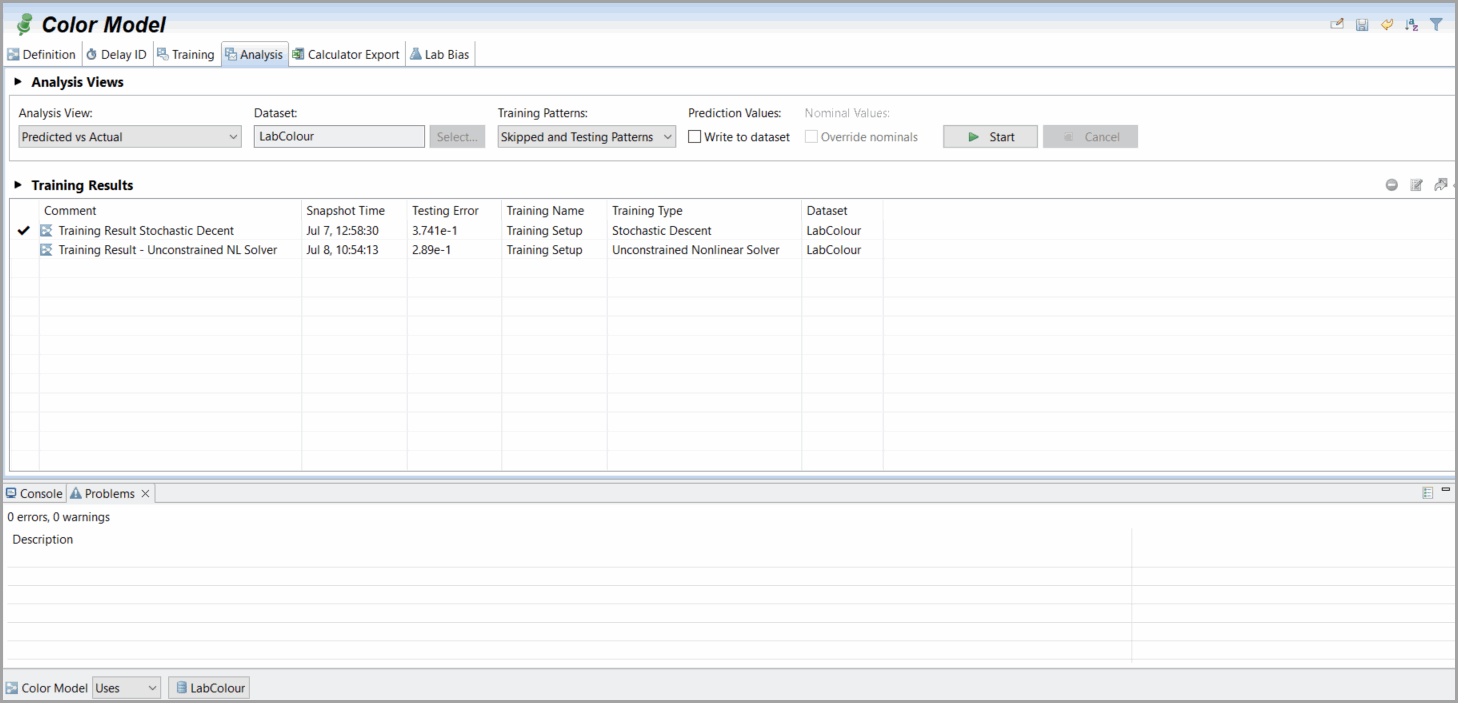
Several analysis options and settings are supported in the analysis tab for the selected model definition.
Analysis View supports user selection of desired views:
- Predicted vs Actual produces an xy plot of model prediction versus actual on selected Training Patterns.
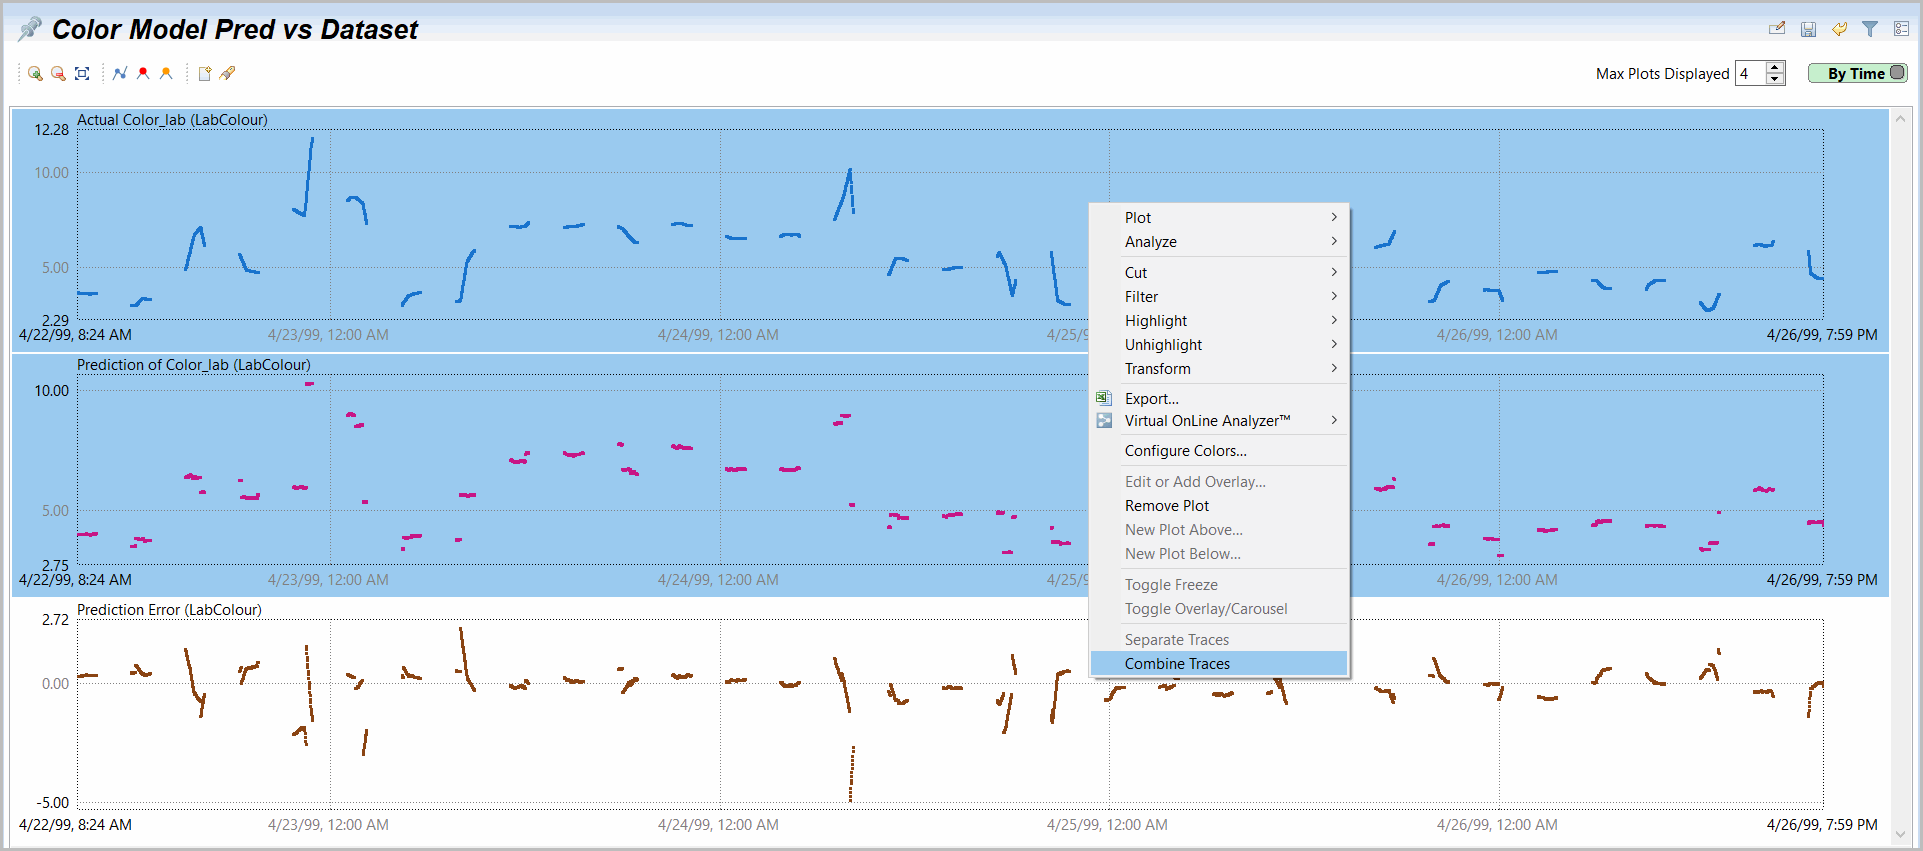
- Prediction of each output over the dataset produces a trend plot (Row or Time) of actual (measured), model prediction and prediction residual on selected Training Patterns.
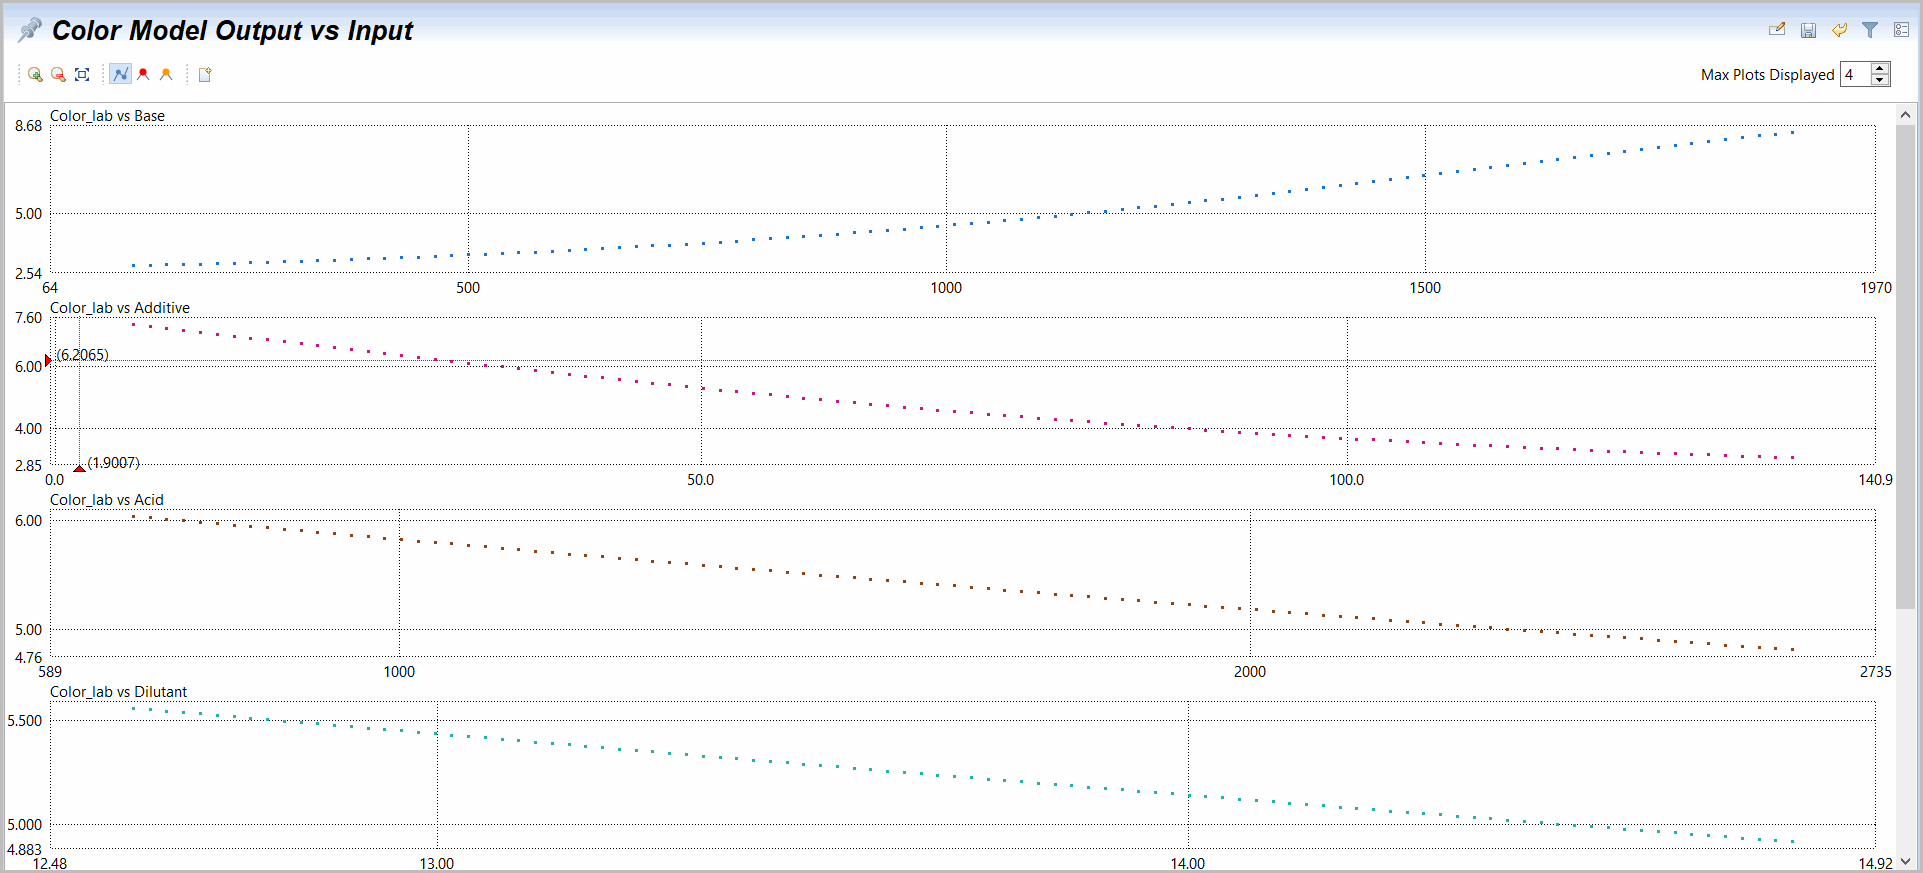
- Prediction of each output versus inputs produces a set of input variable modeled output response curves at definition or adjusted nominal values on every other input. The input variables are ordered from largest to smallest change in model output over responses.
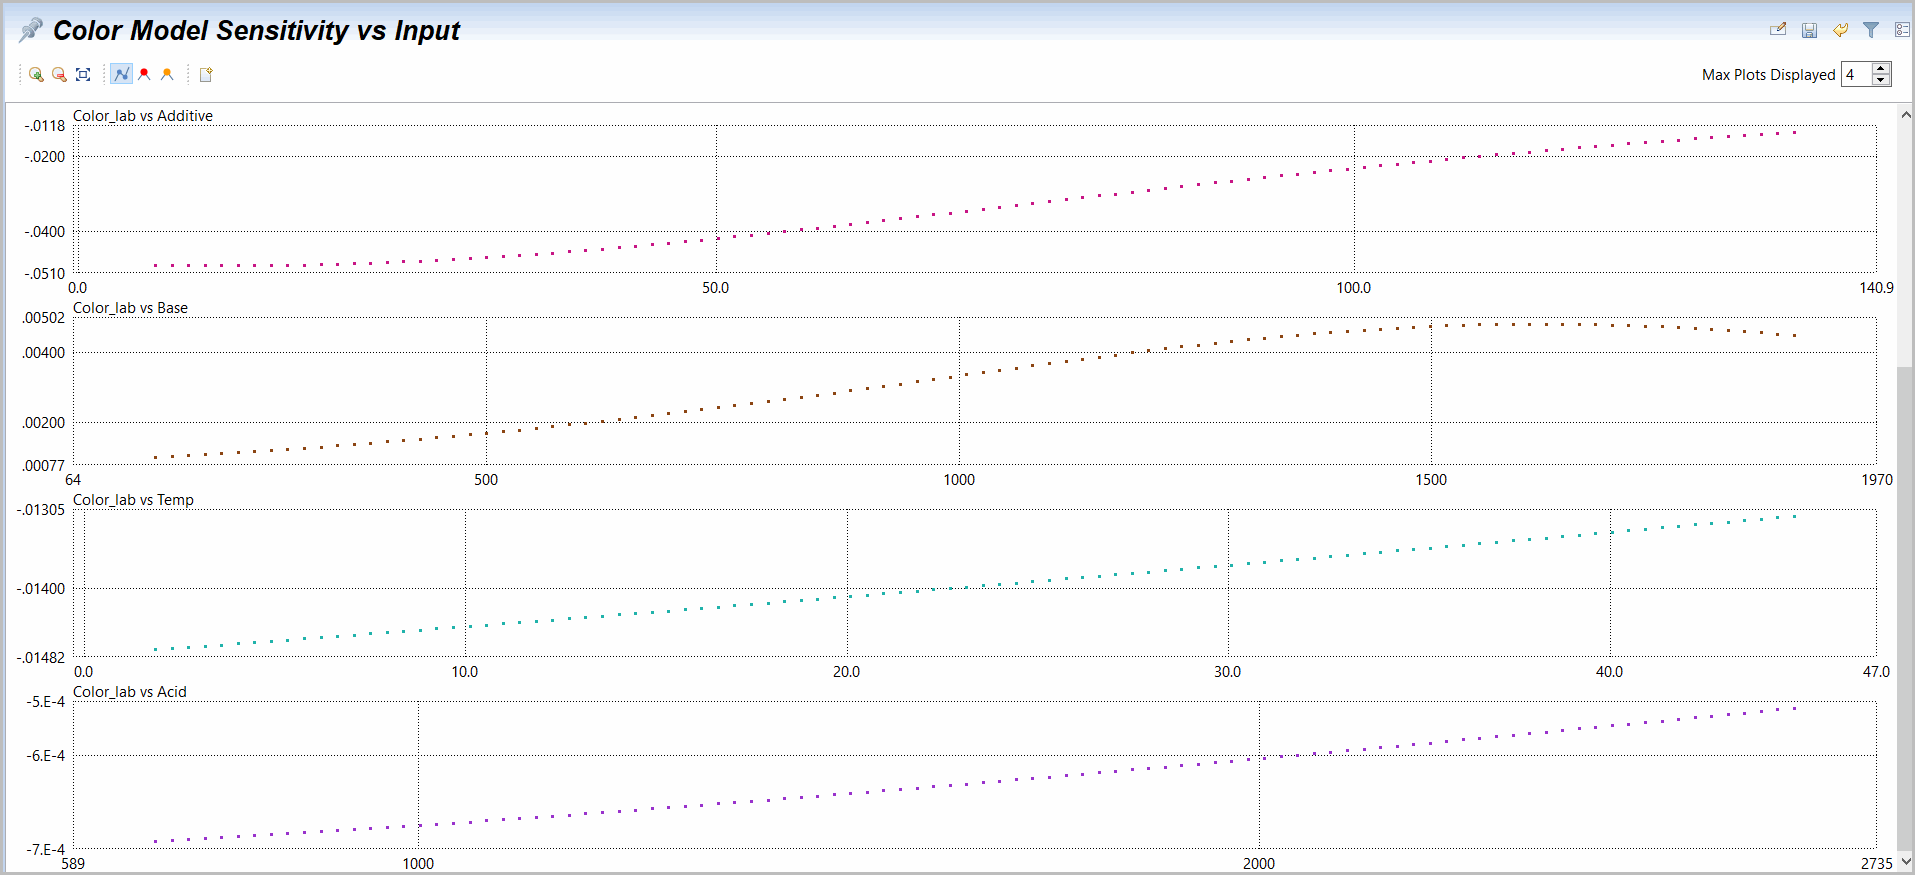
- Sensitivity of each output versus inputs produces a set of modelled sensitivity plots ((output)/ (input) normalized by variable ranges) on each input in ordered from largest to smallest sensitivity change in normalized modelled sensitivities.
- Sensitivity versus Rank provides a ranked order selected training pattern averaged sensitivity (normalized derivatives) on each model output. Sensitivities (normalized derivatives) averaged over dataset population provides the relative ranked influence on each input on the output based on dataset population.
Dataset
selection is active whenever more than one dataset is connected to the model in the definition tab and allows selection of all or any sub-set of available datasets with model variables (which leverages the editable Variable column label). Training Patterns
selection used on most (but not all of the Analysis Views) enables the user to select the desired sets of dataset training patterns (Skipped & Testing, All, Skipped or Testing).Write to Dataset
selection takes the calculations from the relevant dataset driven Analysis Views and writes the results as new variables in the dataset (for example, predictions or prediction residuals). Note this remains selected until unselected and should generally be unselected once desired information is written back to the dataset. Override nominals
are active on select model-based analyses to adjust the nominal value of other variable as select variable response surfaces are plotted. [ Training Results
provides access to run desired analysis against any selected, previously saved training result. Note that the same icons are available as on the training tab to manage training results.Predicted vs Actual Analysis Plot
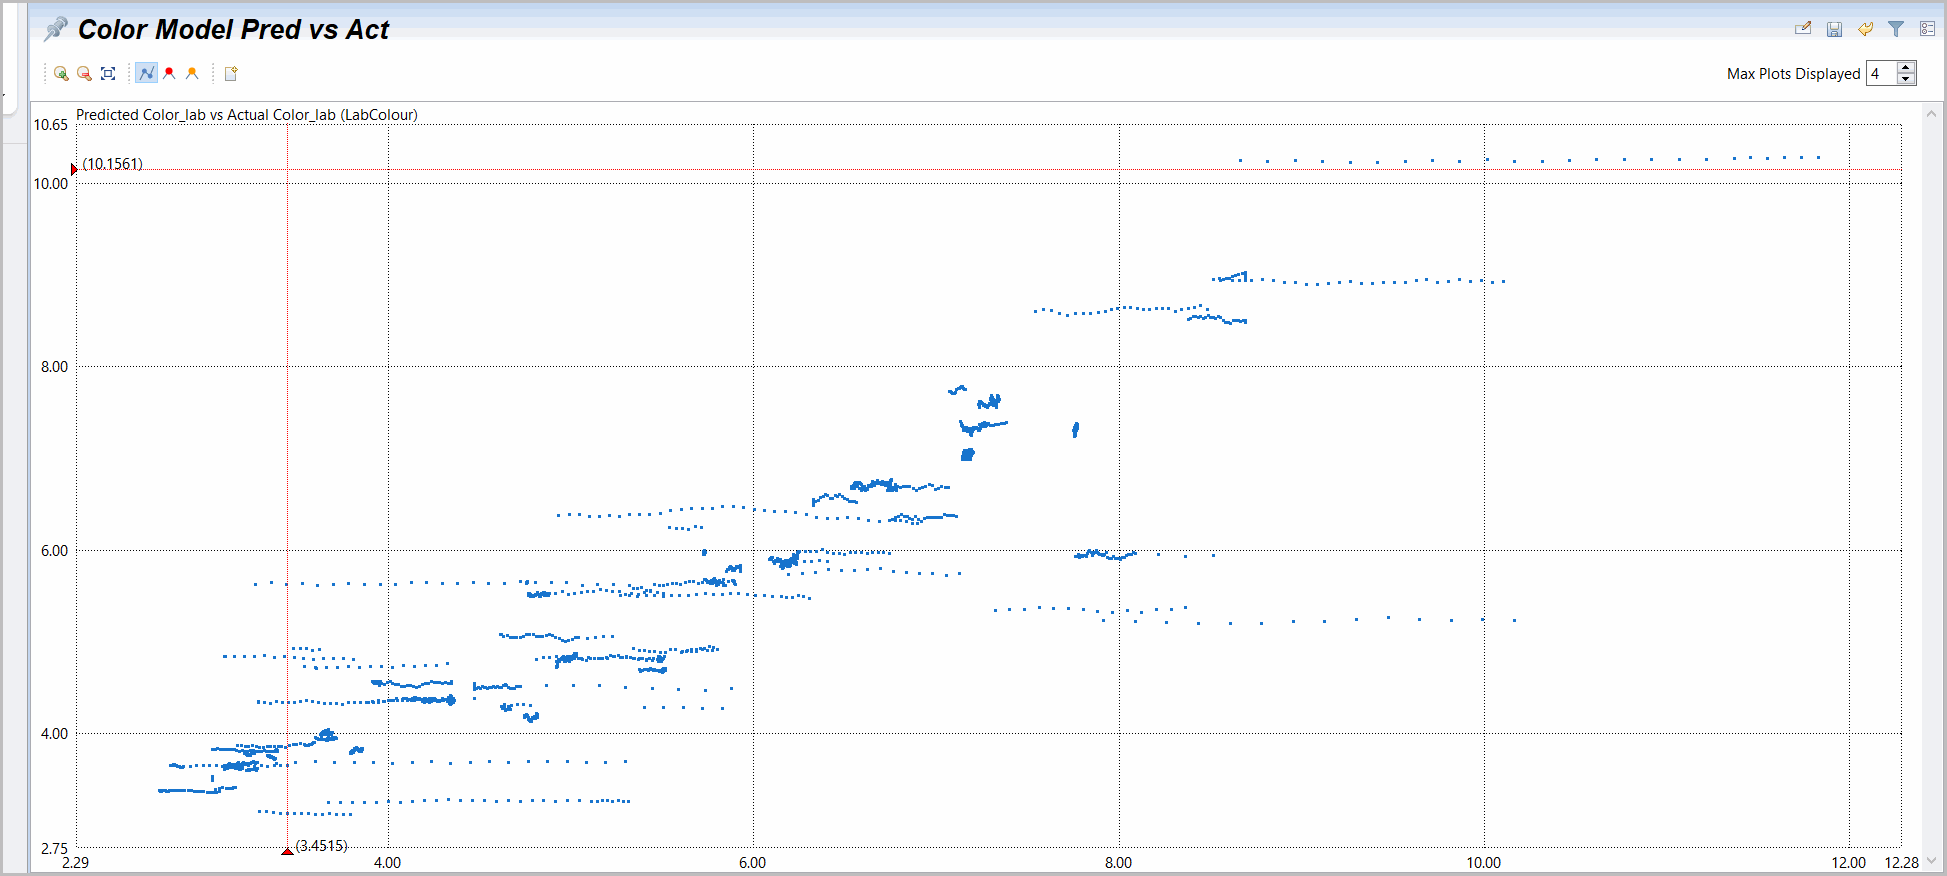
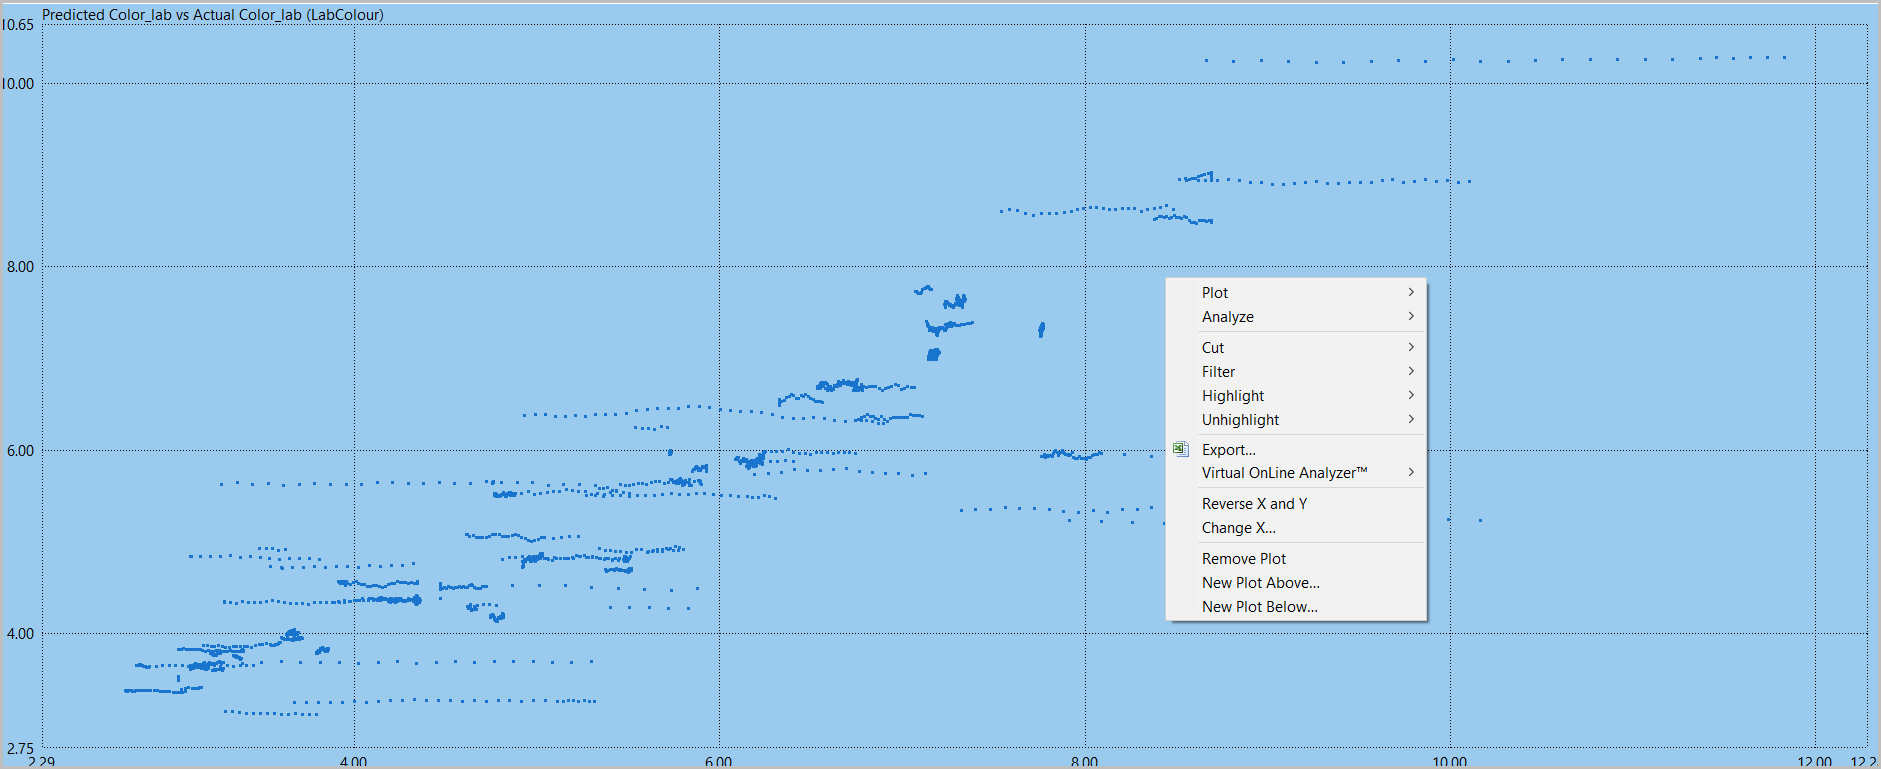
Note that the plotting tools provide the standard supported plot functionality including saving, renaming and generation of different types of plots or plot configurations. But also note that when calculations are not written back to the dataset that a new, independent analysis only dataset is produced and does not include the original datasets. Analysis datasets will generally be temporary.
Predicted vs Actual Analysis Plot
Predicted vs Actual over Dataset Analysis Plot
Output vs Input Analysis Plots
Sensitivity vs Input Analysis Plots
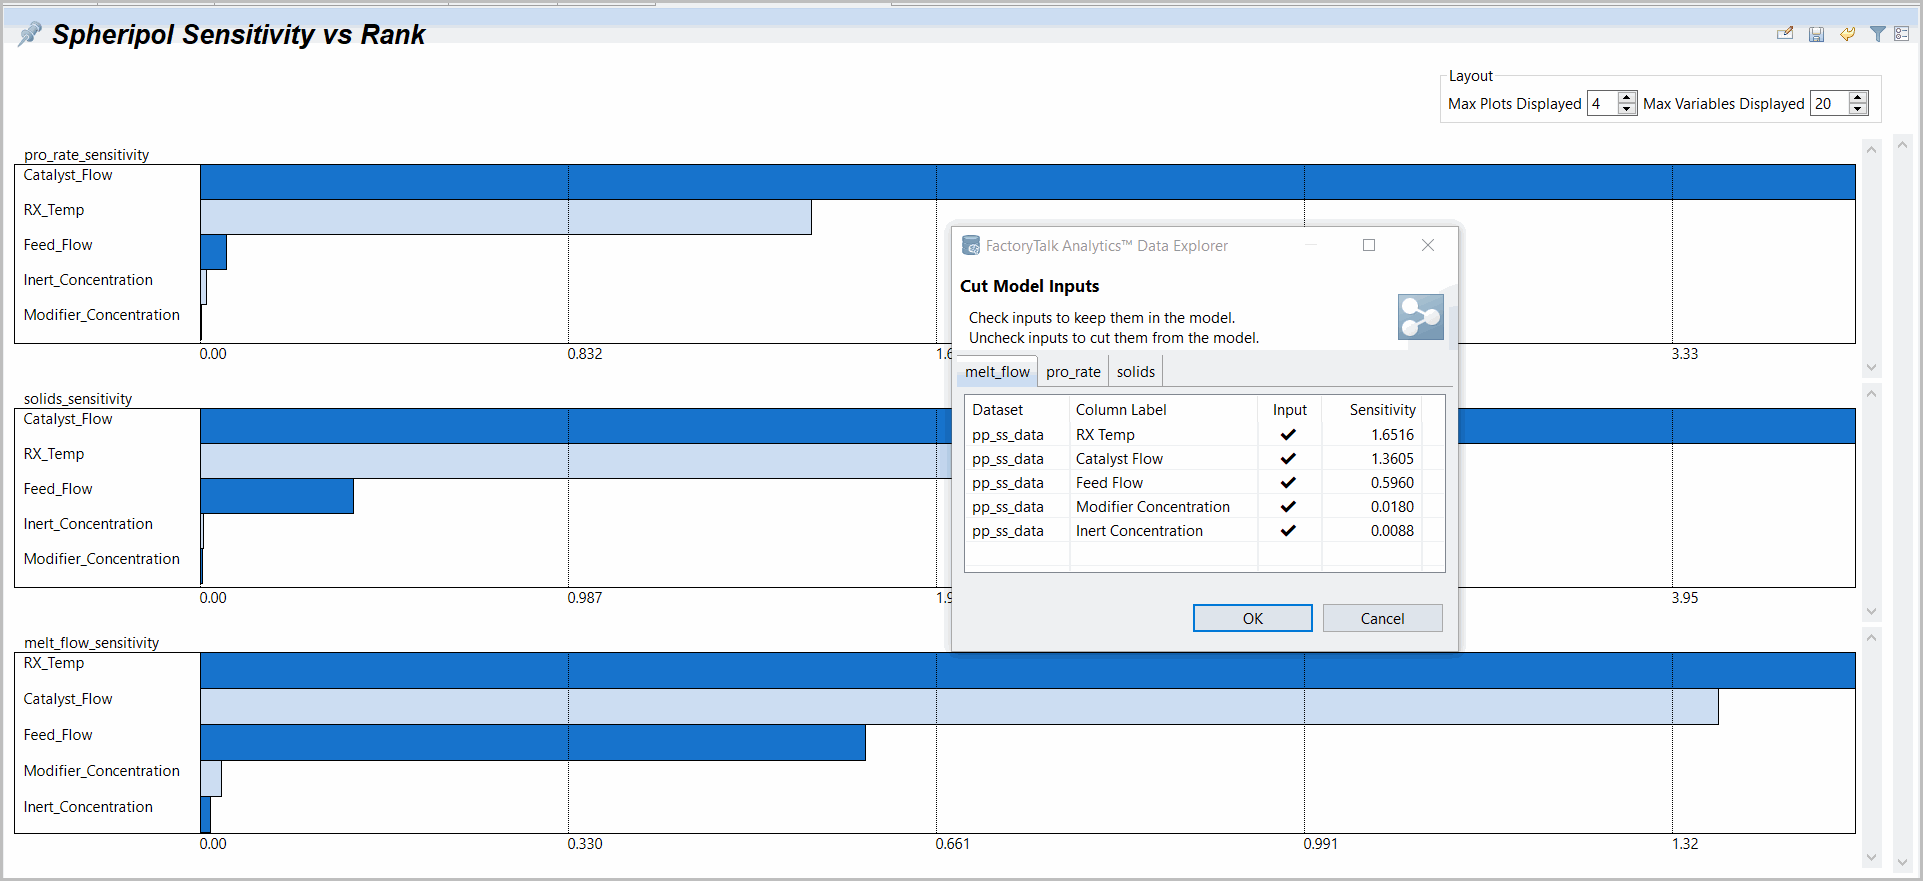
Sensitivity vs Rank Analysis Plots
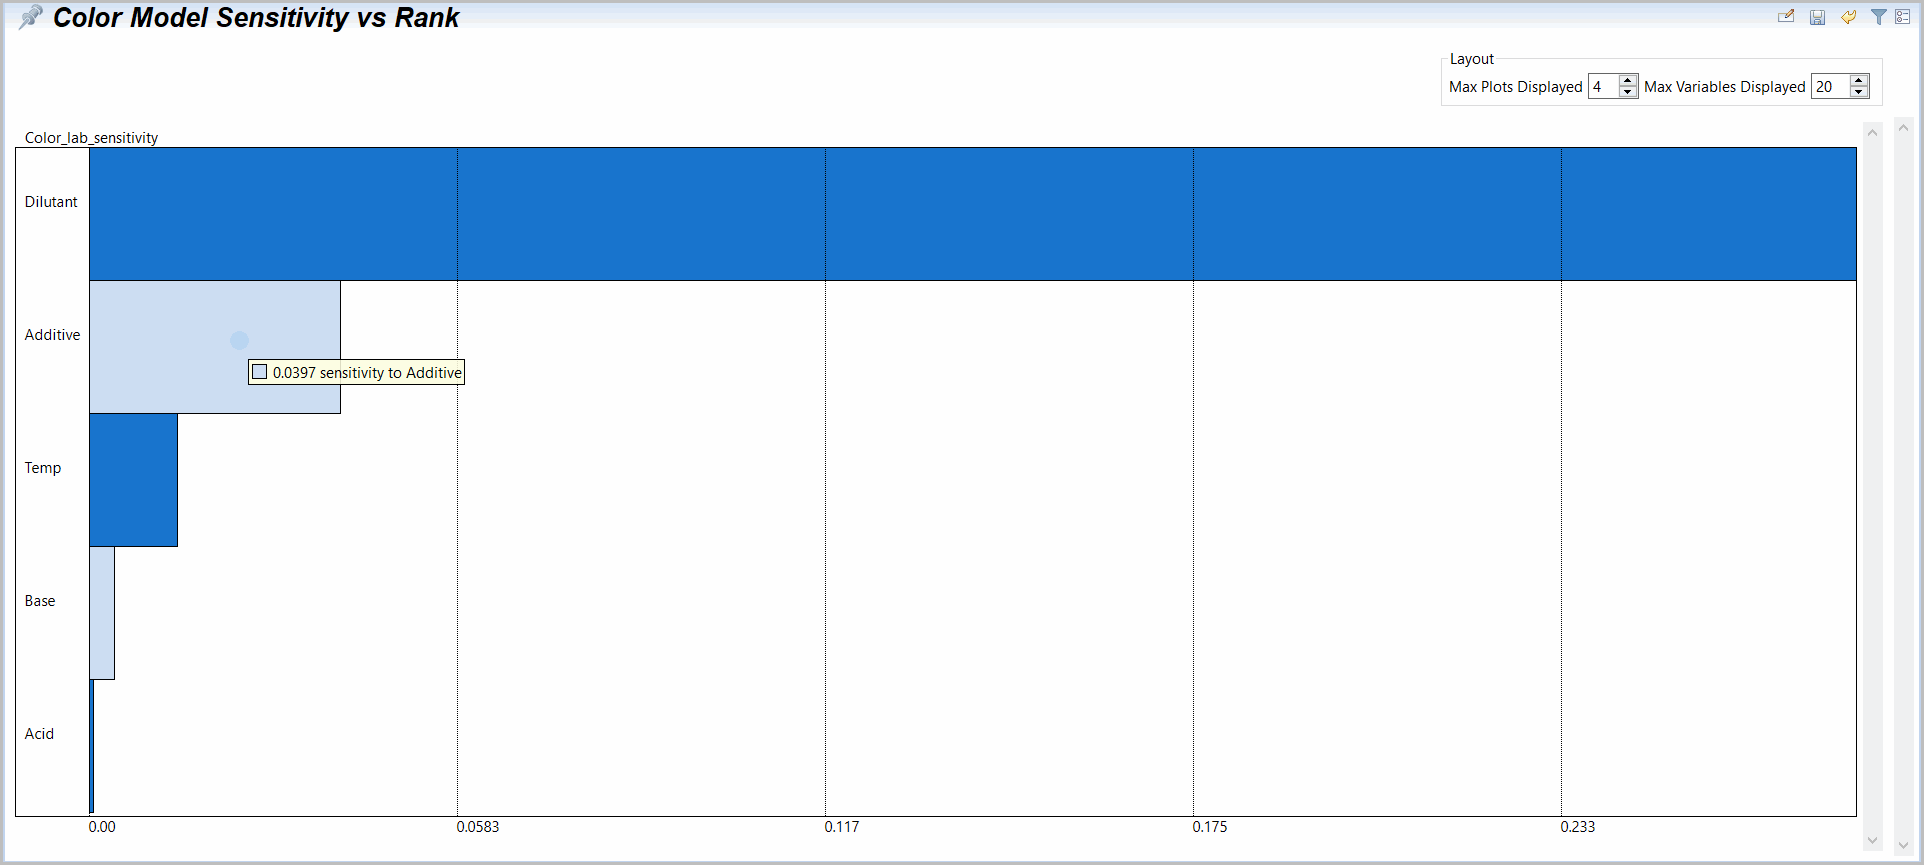
Note that Sensitivity vs Rank plots is ordered by that average, normalized input variable sensitivity or output modelled influence averaged over the dataset population. This plot supports single or multiple output variable models and automated variable cuts, which supports user model feature reduction to reduce the number of input variables sensibly on many models. If you right mouse click on this plot an option to 'Cut Model inputs' is provided.
Sensitivity vs Rank Analysis Plots Function
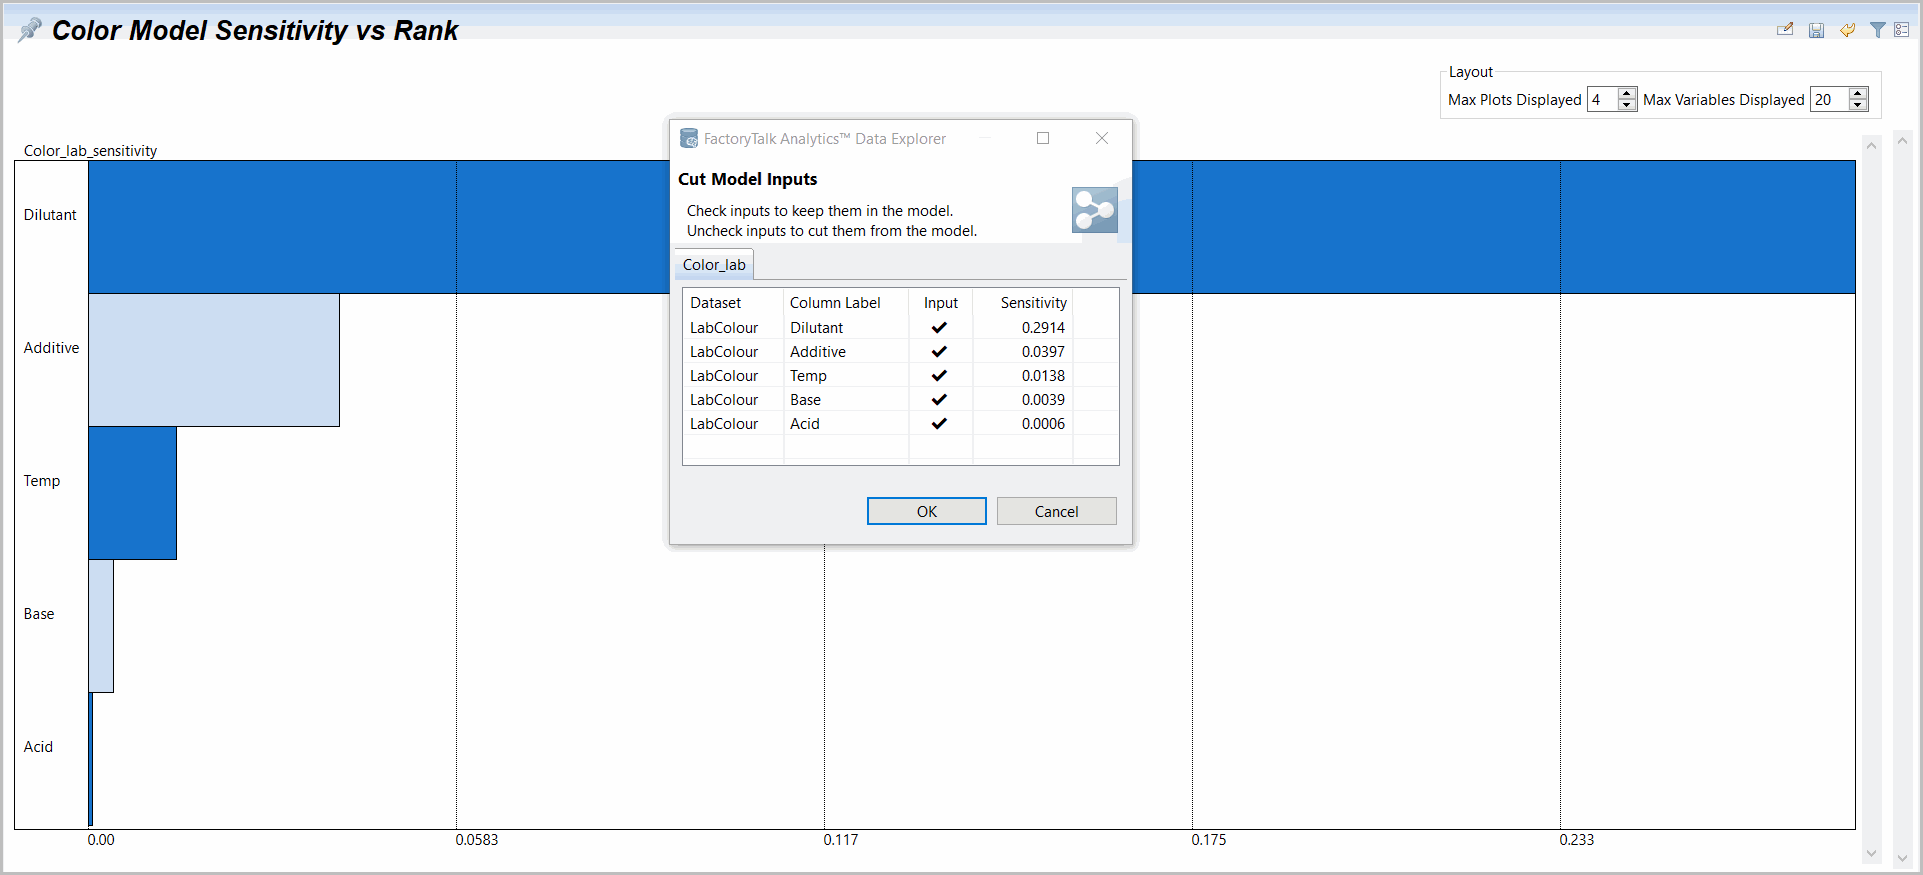
Users may select one or more model included inputs. If more than one output variable is included the plot provides ranked variable and different tabs to select input variables to eliminate. But note that on a multi-output model input variables are eliminated on all outputs. Also note that for many input models multi-select (ctrl- or shift-select) is supported if desired with a right mouse-click to make a multi-select cut. Select OK to execute changes on the cuts pop-up window. The model training window will be automatically selected as re-training is required after eliminating insignificant inputs and revaluating the new model is recommended.
Sensitivity vs Rank Analysis Plots Function
Finally, the back and forth on feature elimination and identification is supported by both:
- Sensitivity cuts to eliminate desired insignificant inputs, and
- Prediction over dataset, while writing back to the original dataset so that the prediction residual can be analyzed with Ranked Correlation. By comparing the active model inputs against those relatively high on ranked correlation with model residual error, potential new features may show strong correlation with model gaps.
Provide Feedback