Cutting Data
To cut data, right-click on your selected data and go to Cut > a cut option. For example, if you want to cut data below a certain value:
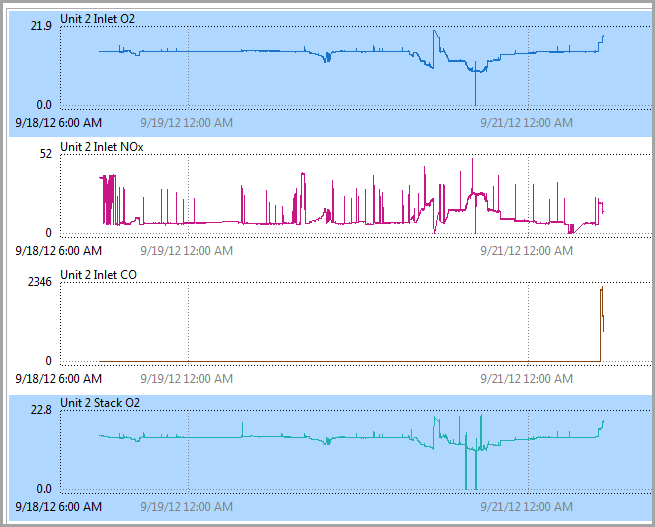
- Select the data you want to edit.Selected Data
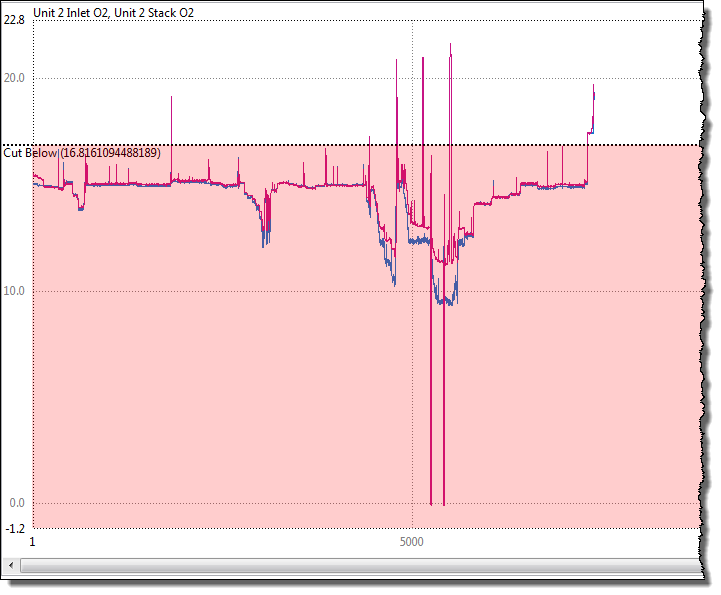
- Right-click on the data and go to Cut > Cut Below Value. Your data displays as follows:Cut Dialog
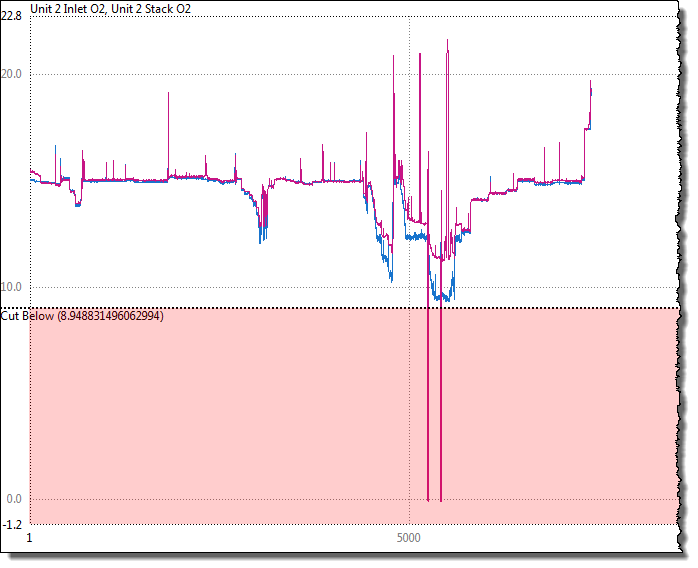
- Define the area you want to cut below by dragging the line down to that levelArea to Cut Defined
 In the upper left corner, you have the option to change fromcut(remove data) toclip(set data to a limit) as well as select data from below the line, above the line, or both. You also have the option to set a specific value numerically.Cut Options
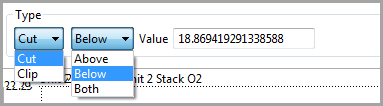
- Click [Apply]. The selected area is now cut from the plot.Cut Data
- You may also cut by row (Cut > Cut Rows) or time (Cut > Cut Time). In those dialogs, do one of the following to select the area to cut:
- To zoom into a section, drag your mouse across the section. Click [Drag for Zoom] to toggle to [Drag Cut]. Drag your mouse across the area you want to cut and click [Apply].TIP:This can be quicker and simpler if you include one or two extra 'good' values on each side.
- Click [+New] and enter the start and end rows/time to cut and then click [Apply].
Provide Feedback