Highlighting Data
You can highlight data in a plot or analysis tool using the Highlighter icon. Highlighting can be started graphically by using Alt-select and dragging a box around the data to be highlighted. This can occur multiple times. Use Shift-Alt-select-drag to unhighlight (graphically, also multiple unselect sections allowed). The master highlight icon allows users to undo-last, clear-all, and edit a highlight sequence set or convert to a retained filter.
- Click theHighlightericon to open anActive Highlightertab Click the Highlighter icon to open an Active Highlighter tab.Active Highlighter Tab
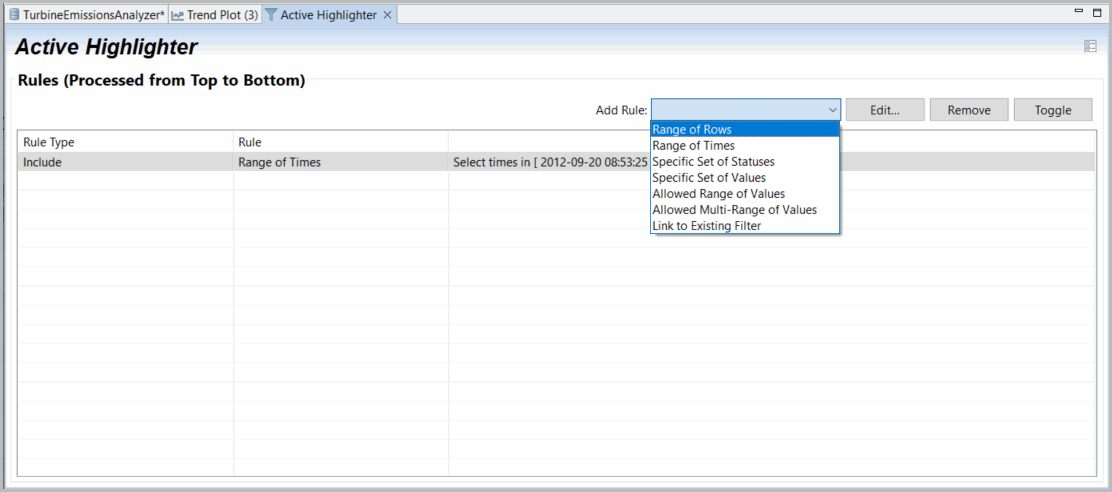
- From theAdd Ruledrop-down menu, select a type of highlight rule to add. You can choose from the following:
- Data within a range of rows and times
- Data within a specific set of statuses and values
- Data within an allowed range or ranges of values
- Data linked to an existing filter
- To save your rules for future use, click theHighlightericon or selectSave as a New Filterfrom the drop-down menu of theHighlightericon. Access your saved rules by clicking theOpen Projects Windowicon and selecting the rules set. It will be listed as a Dataset Filter, which may be renamed from the Filter tab.
To add a new rule to the highlighter, click the
Highlighter
icon to open the Active Highlighter
tab, and select your rule. Clicking Edit
from the Highlighter
icon’s drop-down menu also opens your list of rules.To remove a highlight rule, select the rule in the
Active Highlighter
tab and click [Remove Selected].Click [Toggle Include/Exclude] to toggle between applying and removing the selected highlighter rule on your data. You can also use the
Remove Last
and Reapply Last
options from the drop-down menu for the same purpose.To undo all highlights, click
Reset…
in the Highlighter
icon’s drop-down menu.Provide Feedback