Carousel Plots
Carousel plots group the variables into two rows. However, rather than overlaying all the variables in one row, it allows paging through the variables in that row. For carousel plots, you will be asked to define the variables for the top row. Then a right/left arrow is displayed on the following trends to allow secondary (not top) variables to be compared to the primary first variable.
Use carousel plots for three or more variables. One variable is frozen in place in the top row, and one is displayed in the second row with arrows that let you scroll through all the selected variables other than the top one. For example, make a plot of variables A, B, C, D, and pick A for the top row. Initially, you will see A and B. When you click the arrow key, you will see A and C. Click the arrow key again to see A and D. Click back to see A and B.
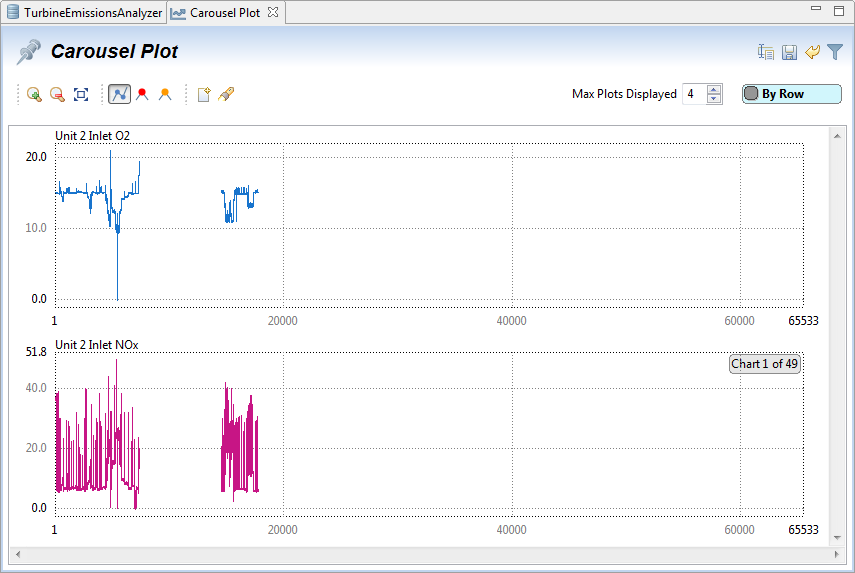
Carousel Plot
Provide Feedback