Search
4.05.00 FactoryTalk Data Explorer User Guide
Overlay Plots
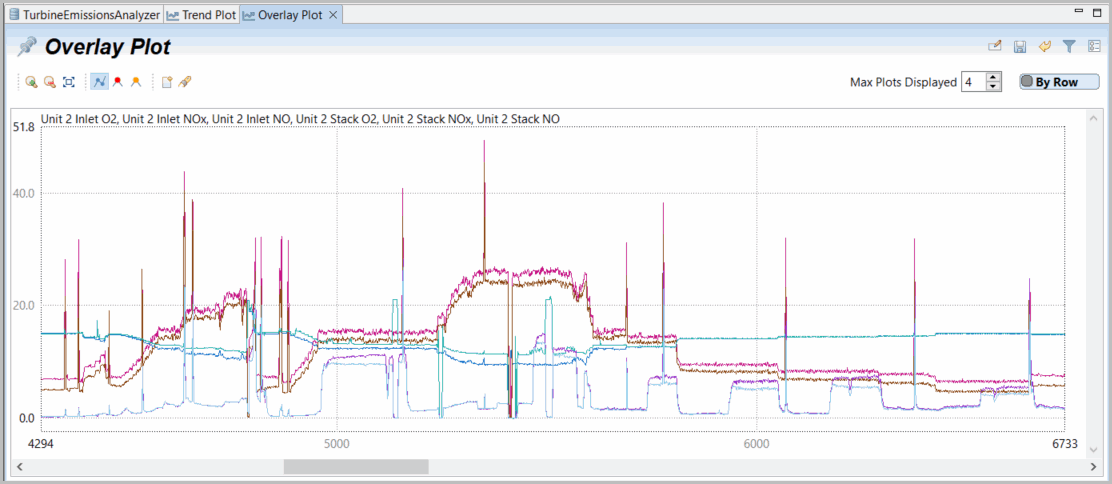
Overlay Plot
: plots data using multiple charts overlaid on top of one another on a single pair of axes. Note that maximum number of plots that can be overlaid is a preference option.
Overlay Plot
Plotting Data
Provide Feedback
Have questions or feedback about this documentation? Please
submit your feedback here
.