Raw vs Transform Plots
Raw vs Transform plots displays data using both the raw data and transformed data. If the selected variable is a raw variable (as defined in “Data Preparation”), then this plot shows two traces on the same pair of axes, the before-transforms values and the after-transforms values, so you can see the effect of the transforms. If there are no transforms on this variable, then the two traces will be identical. However, if the selected variable is not raw, then it does not have any before-transforms values, and this plot shows only one trace, the after-transforms values.
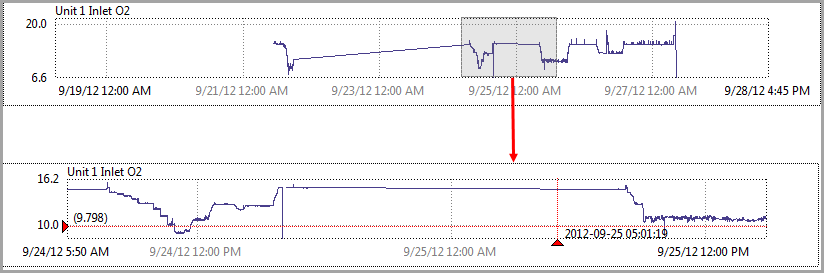
For example, suppose that Unit 2 O2 and NOx are process variables that have noisy measurements.
Raw vs Transform Plot Example
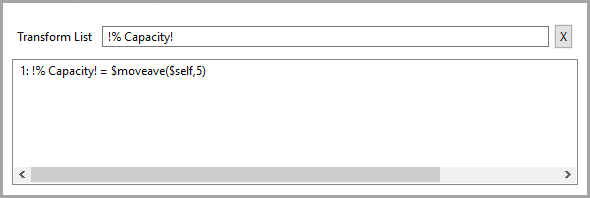
You can apply a moving average transform to smooth out the noise.
Smoothing Configuration
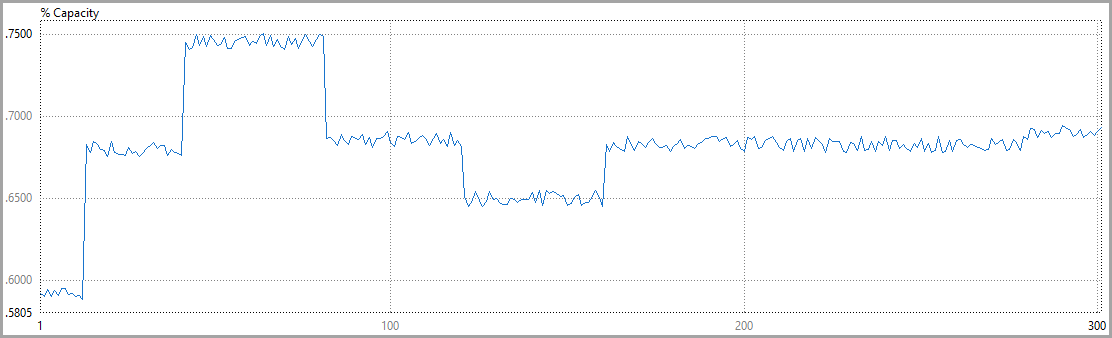
The Raw vs Transform plot now shows the original data (blue) and the smoothed data (red). Note that if there is no transformation on a variable only one color will be visible as they exactly overlay each other (raw and transformed variables).
Raw vs Transform Plot
Provide Feedback