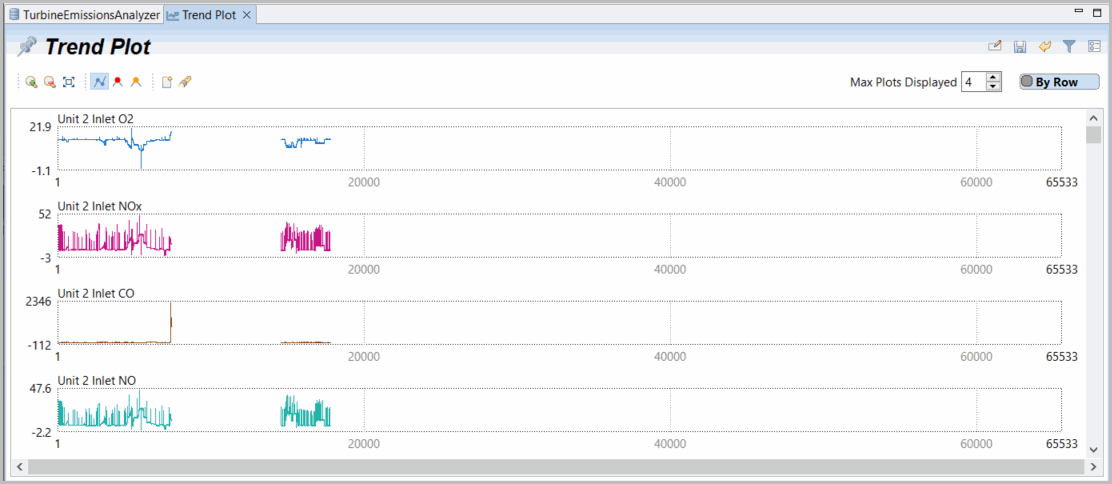
Trend Plots
Trend plots display the trend of data over a period of rows or time (select the By Row or By Time button as desired).
Trend Plot
These same options are available for most plot functions, but with different options on xy plots.
With a right mouse-click on a trend plot the following options are available. Plot and Analyze offer plotting and analysis options for the selected plot variables.
Cut - offers graphical cutting above, below, both, row or time cuts to eliminate data directly on a plot pop-up on selected variables.
Filter - offers graphical filtering to filter data above, below, both, or within row or time-ranges or when any or all are valid (also supporting multi-variable selections).
Highlight - offers graphical highlighting to highlight above, below, both or within row or time-ranges or when any or all are valid. Highlight is also offered directly on the plots with alt-drag across data box of interest.
Trend Plot Options
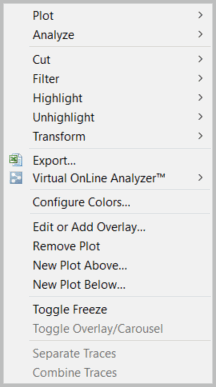
Unhighlight - offers graphical unhighlighting (erase previously selected highlights) above, below, both or within row or time-ranges or when any or all are valid. Unhighlight is also offered directly on the plot with Shift-Alt-dragging across data box of interest.
Transform offers a variety of simple transformations on selected variables including Enter a new transform, Show existing transforms, Smooth data (with ExpAve) or apply a Dynamic filter.
Export generates a new export configuration including selected variables that may be edited within the tab.
Virtual Online Analyzer selects variables to pre-populate variables to be included in regression model definition. Variables may be edited during the modeling process. Configure colors offers a color pop-up of available colors to use on selected plot variables.
Edit or add overlay plot allows the user to select additional variables to overlay on top of a selected plot or remove current variables on that plot.
Remove a plot allows the user to remove selected variables from a set of previously selected plot variables.
New plot above or below allows the user to select variables to add above or below a selected plot variable.
Toggle Freeze places selected plot variables at the top of the plot window and enables the user to scroll through other plot variables with a fixed header plot of the frozen variables.
Toggle Overlay or Carousel plots are active on overlay or carousel plots and enables the user to modify the overlay or Carousel selected variables.
Separate Traces is active when selected variables are combined in an overlay plot. The overlaid variables would be plotted as separate plots.
Combine traces is active when multiple plots are selected and they are overlaid on one plot.
Provide Feedback