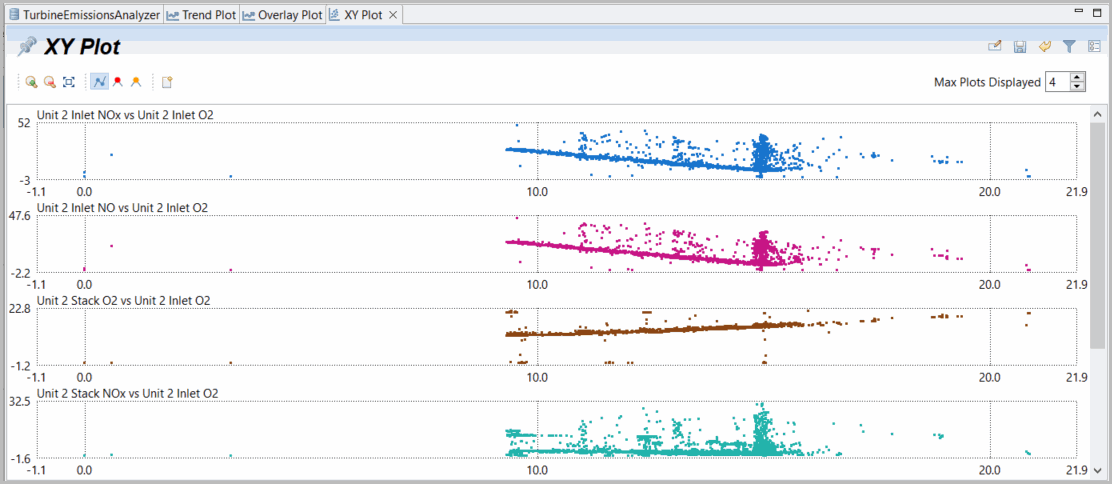
XY Plots
XY plots display one variable on the X axis and one or more variables on the Y axis. When you select an XY plot, the parameters that appear are X Variable and Y Variables. XY plots are useful to compare the relationship of one variable versus another and the highlighter or filter options help select and investigate unusual XY behaviors.
For XY plots, you will be asked to define the variable for the X axis.
From the plot along with zoom, highlight and filter options the user has the option to reverse X and Y, or replace the X variable.
NOTE:
When applying cuts from the xy plot, please note that the cut value ranges are applied to both the X and Y variables which is often not what is desired.
For an XY plot, the only supported Line Type is Lines off and Points on. Connecting lines has limited sense in an XY plot. Zoom is fully supported as is filter, highlighting, and optionally displaying error or cut data.
XY Plot
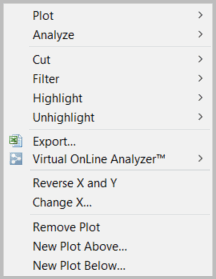
Most of these options are the same options as described above with Trend Plots. This is a reduced list of options as appropriate for xy plots with two variables. New options include:
Reverse X and Y switches the x-variable and the y-variable. This also works on multi-selection on plots.
Change X enables the user to select a new variable for the x-axis and also may do this simultaneously for one, multiple or all variables as selected.
Menu
Provide Feedback