- Getting started
- Creating projects
- OPC UA
- Graphic objects
- Predefined graphic objects
- Sessions and locales
- Object and variable references
- Extending projects
- NetLogic
- NetLogic tutorial
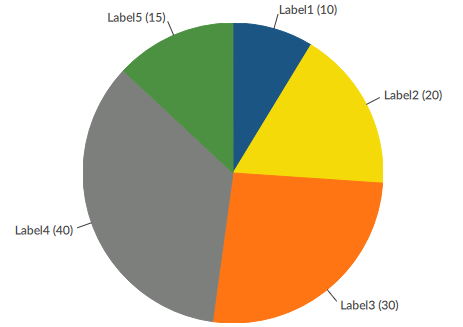
Pie chart
Display data in the form of a pie chart.
Example
Provide Feedback