Create innovative, sustainable products and solutions, and foster a culture that empowers employees to operate safely, sustainably, and responsibly. Our commitment to ethics and integrity is a competitive advantage and a way to differentiate ourselves to our customers, partners, shareholders, and employees.
Our Sustainability Goals


Environmental Performance

Progress Toward Carbon Neutral
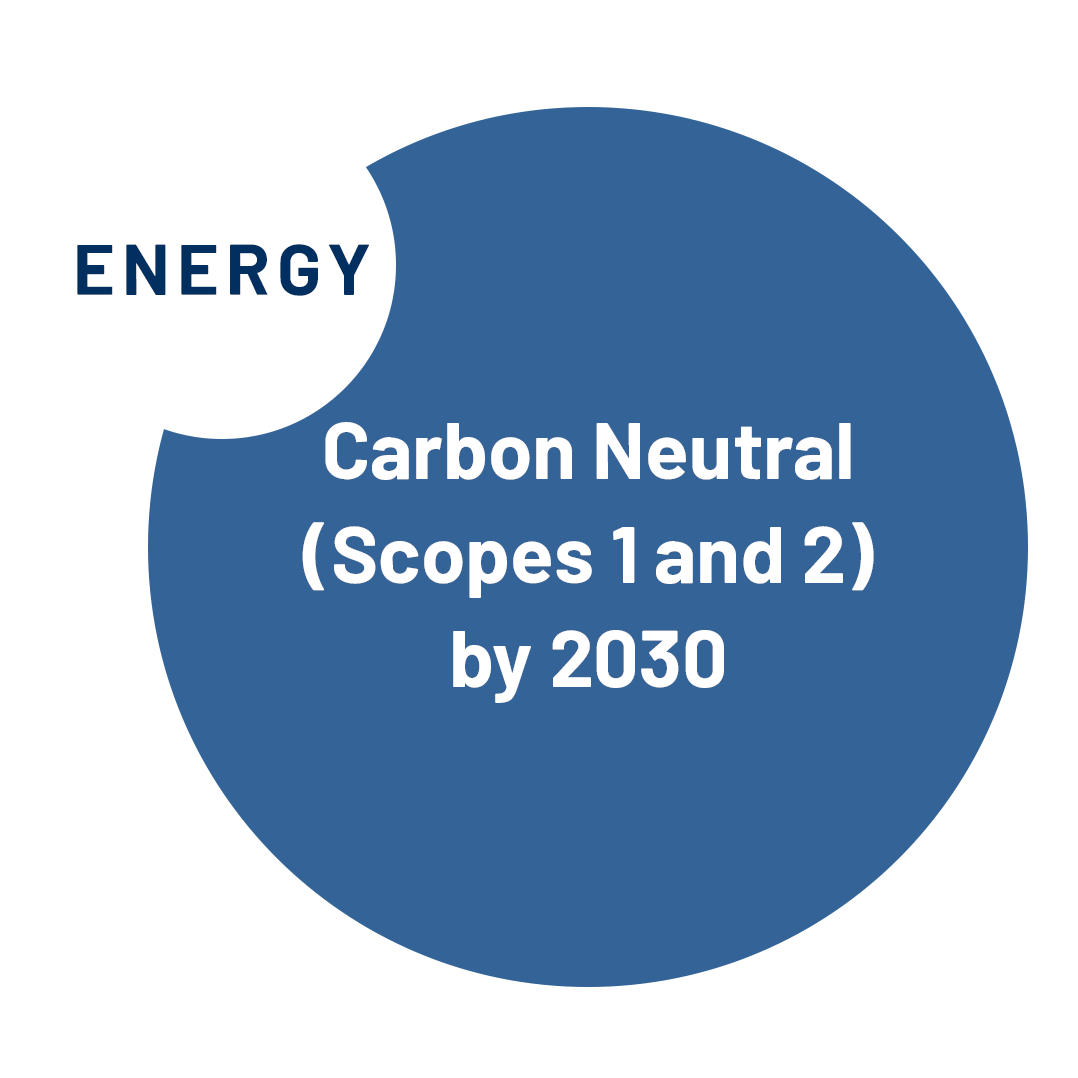
Carbon Neutral by 2030 (Scope 1 & 2)
- Increasing energy efficiency
- Greening our fleet
- Pursing virtual purchase power agreements
Value Chain Baseline (Scope 3)
- Following Greenhouse Gas Protocol
- Indirect emissions represent 99% of our total carbon footprint
- Scope 3 contributions:
- Use of sold products
- Purchased goods & services
- Upstream Transportation
Carbon Neutral by 2030 (Scope 1 & 2)
Normalized Emissions Trend
Scopes 1 & 2 emissions, as metric tons of CO2 equivalent per million USD of sales
Total normalized emissions continued to trend in a positive direction, demonstrating our record of providing added value with a similar emissions footprint.
Emissions Summary
Scope 1 - 24,443 metric tons
Scope 2 - 85,522 metric tons
NOT DONE - STILL NEED TO SPECIFIC DATA POINTS AND COLORS (NOT LISTED ON IMAGE)
109,965 total metric tons of CO2 equivalent
In 2023, our greenhouse gas (GHG) emissions remained flat. Increased emissions with the addition of Sensia, a joint venture, and the recent acquisitions of CUBIC, and ASEM to Rockwell operations and reporting were offset by the purchase of green energy in our Katowice, Poland facility and increased energy efficiency across our portfolio.
Value Chain Baseline (Scope 3)

| Scope 3 Categories1 | Metric Tons of CO2 Equivalent2 |
|---|---|
| 01: Purchased Goods & Services | 613,000 |
| 02: Capital Goods | 26,000 |
| 03: Fuel & Energy Related | 32,000 |
| 04: Upstream Transportation | 332,000 |
| 05: Waste Disposal | 3,000 |
| 06: Business Travel | 24,000 |
| 07: Employee Commuting | 14,000 |
| 08: Upstream Leased Assets | 1,000 |
| 09: Downstream Transportation | 30,000 |
| 11: Use of Sold Products | 14,179,000 |
| 12: End-of-life Treatment of Sold Products | 23,000 |
| 15: Investments | 54,000 |
| Total | 15,331,000 |
1 Categories 10, 13, and 14 are not applicable to Rockwell and thus, not listed.
2 This baseline represents data from greater than two thirds of our core operations, in conformance with the SBTi Criteria and Recommendations for Near-Term Targets, Version 5.1. Thus, some data is not included, such as Sensia, CUBIC, and ASEM.
Waste
Waste Recycled
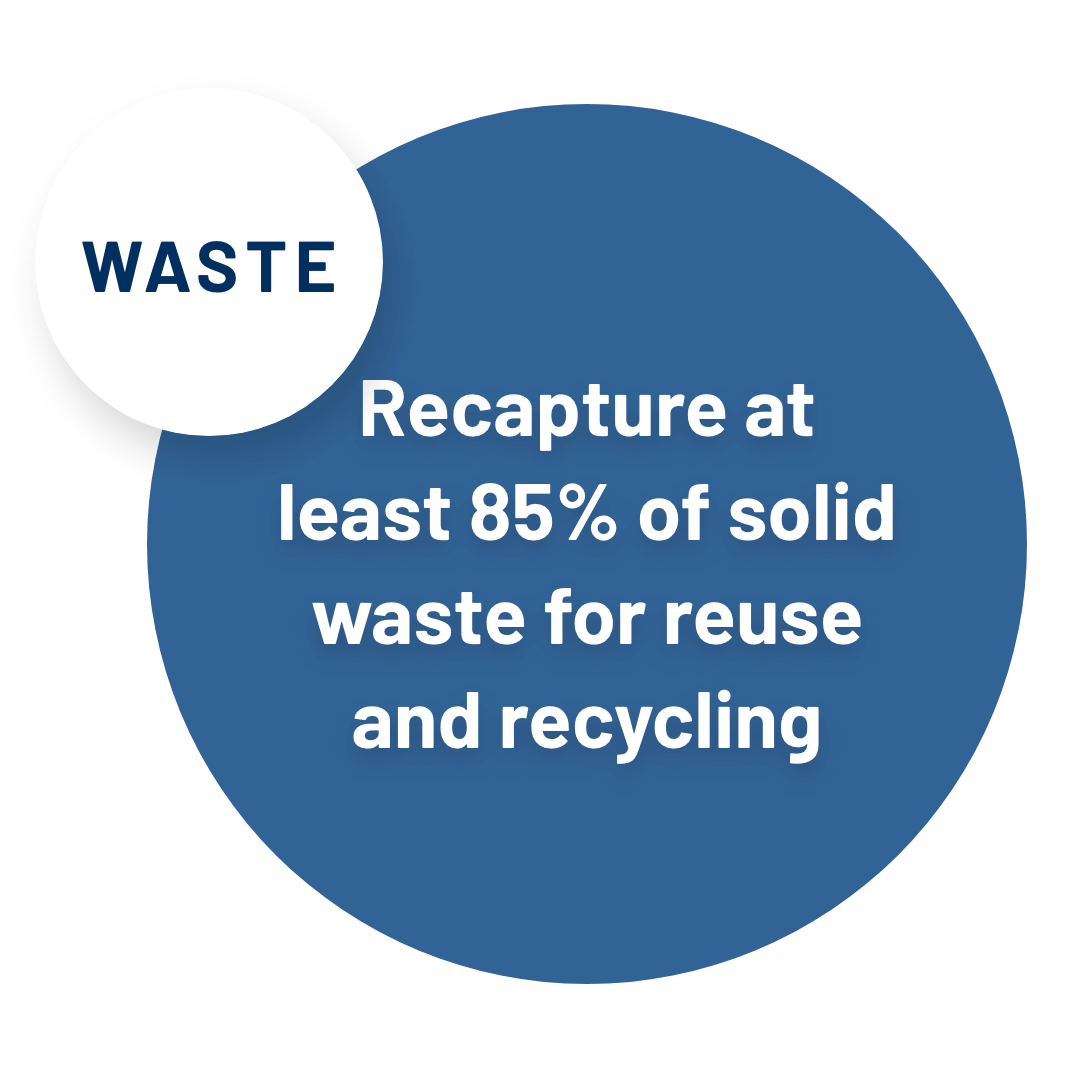
Our goal is to have 85% or more of our waste diverted from landfill through recycling, reuse, and energy reclaimation, and we achieved that goal in 2023. In FY24, we are increasing our goal to 90%.
Hazardous Waste
In 2023, hazardous waste accounted for 4.2% of our total waste generated, a reduction from 8.8% in 2022. We continued to report waste categorized as hazardous in accordance with local law, with streams including electronics (classified as hazardous in some countries), lead-containing materials, and expired/unusable materials.
4.2% of total generated waste
512 metric tons of hazardous waste generated
12% of hazardous waste recycled
10% landfilled, with remainder receiving treatment via incineration or physical/chemical treatment
0 Experienced zero reportable spills
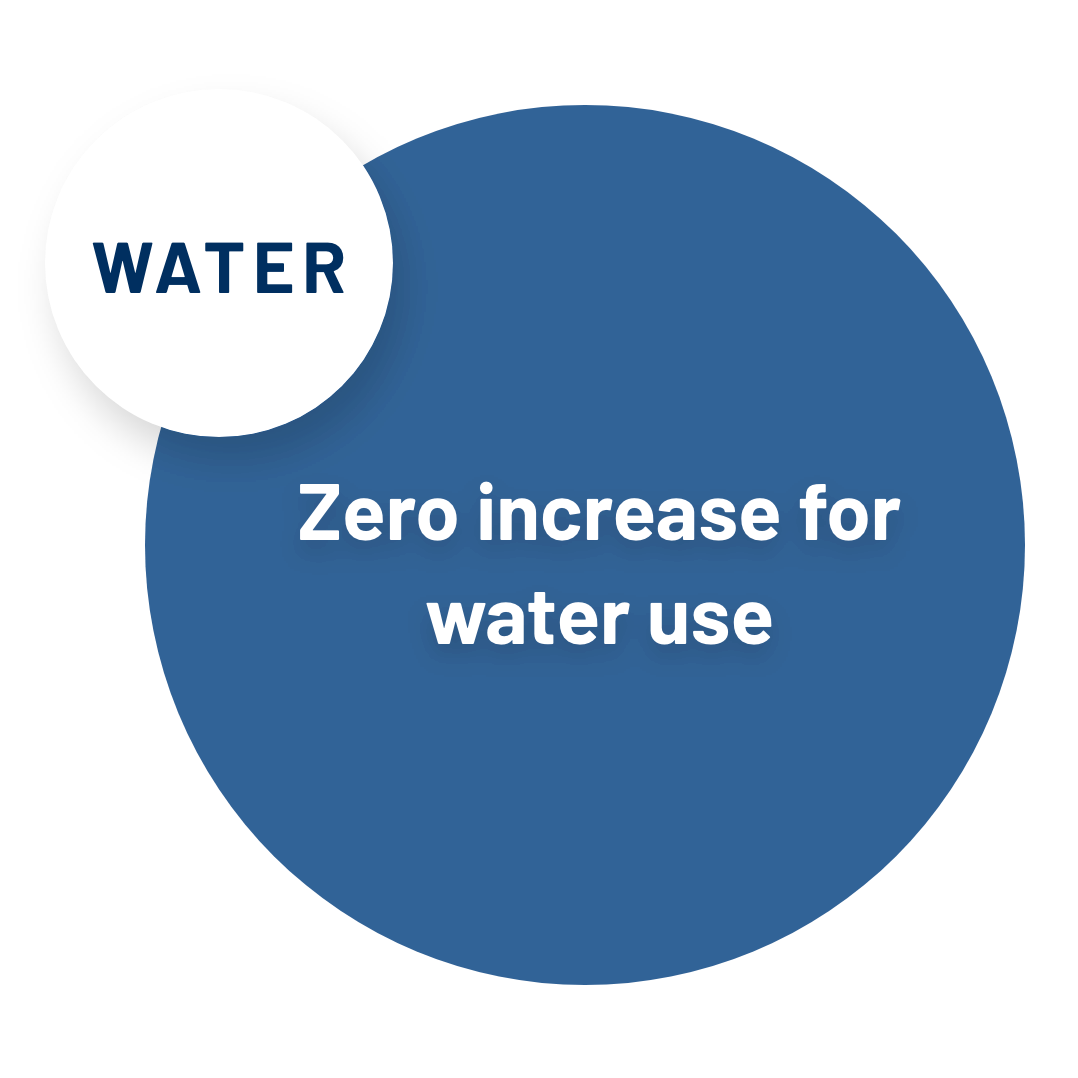
Water Use

NOT DONE - NEED ACTUAL CHART DATA FOR BARS (not included in image)
Water usage is mostly for drinking and washrooms. We use limited water in manufacturing operations and for heating and cooling at our Milwaukee headquarters.
Rockwell, in collaboration with The Water Council, is transitioning from onsite water management to comprehensive site and watershed water stewardship, prioritizing socially equitable, environmentally sustainable, and economically beneficial water usage.
Learn more about our environmental performance in our sustainability report.
Culture
Diverse Thinking Fuels our Innovation
We are creating an inclusive culture by:
- Establishing a diverse, equitable and inclusive work environment where all employees experience trust and belonging
- Optimizing internal and external talent pools and pipelines by attracting, developing, and retaining diverse talent
- Enhancing our ability to inform and influence our industry, engage diverse customers, suppliers and partners, and support the communities in which we live and work
Areas of focus:
- Visibility and ensuring people are aware of opportunities
- Capability and ensuring people have the resources and skills to address the opportunities
Global Gender FY23
BASED ON 29K EMPLOYEES
INDIVIDUAL CONTRIBUTORS
| Female 34% | Male 66% |
PEOPLE MANAGERS
| Female 27% | Male 73% |
TECHNICAL TALENT
| Female 19% | Male 81% |
MANUFACTURING LABOR
| Female 46% | Male 53% | Undisclosed 1% |
U.S. Race & Ethnicity FY23
BASED ON 9.1K U.S. EMPLOYEES (Individual Contributors and People Managers)
INDIVIDUAL CONTRIBUTORS
| Black/African American 9% |
| Asian 11% |
| Latinx 5% |
| White 70% |
| Multiracial, Native American, Pacific Islander 2% |
| Undisclosed 4% |
PEOPLE MANAGERS
| Black/African American 6% |
| Asian 8% |
| Latinx 6% |
| White 76% |
| Multiracial, Native American, Pacific Islander 1% |
| Undisclosed 3% |
TECHNICAL TALENT
| Black/African American 6% |
| Asian 13% |
| Latinx 5% |
| White 72% |
| Multiracial, Native American, Pacific Islander 2% |
| Undisclosed 2% |
MANUFACTURING LABOR
| Black/African American 19% |
| Asian 15% |
| Latinx 4% |
| White 50% |
| Multiracial, Native American, Pacific Islander 2% |
| Undisclosed 10% |
Our Principles
Strengthen our commitment to integrity, diversity, and inclusion
Be willing to compare ourselves to the best alternatives
Increase the speed of decision making
Have a steady stream of fresh ideas
We believe the key to sustainability is information. Every day, we help tens of thousands of global customers achieve productivity and sustainability goals with data-driven solutions. Together we’re expanding our ability to make a positive impact on the world.


