Loading
Investor Relations
  • Why Rockwell
  • News
      • Financial Overview
      • Quarterly Reports
      • Annual Reports and Proxy
      • Interactive Financial Data
      • SEC Filings
    • Financial Overview
    • Quarterly Reports
    • Annual Reports and Proxy
    • Interactive Financial Data
    • SEC Filings
  • Events & Presentations
      • Sustainability
      • Sustainable Customers
      • Sustainable Company
      • Sustainable Communities
      • Reporting and Disclosures
    • Sustainability
    • Sustainable Customers
    • Sustainable Company
    • Sustainable Communities
    • Reporting and Disclosures
      • Executive Leadership
      • Board of Directors
      • Board Committees At-a-Glance
      • Board Committees
      • Governance Documents
      • Ethics and Compliance
    • Executive Leadership
    • Board of Directors
    • Board Committees At-a-Glance
    • Board Committees
    • Governance Documents
    • Ethics and Compliance
      • Investor Resources
      • Stock Information
      • Analyst Coverage
      • Email Alerts & RSS
      • FAQ
    • Investor Resources
    • Stock Information
    • Analyst Coverage
    • Email Alerts & RSS
    • FAQ
  • Contact Us
Financial overview hero background

Financial Overview

Strong balance sheet, cash flow generation and strong track record of returning cash to shareowners
Januar Februar März April Mai Juni Juli August September Oktober November Dezember
Rockwell Automation, Inc. (NYSE: ROK)
NYSE: ROK
The stock quote is temporarily unavailable.

New Strategic Growth Framework

Open All
Close All
Faster secular growth
Chevron DownChevron Down

Customer Needs


  • Resiliency
  • Agility
  • Sustainability

Example of ROK Differentiation


  • Cybersecurity, Augmented Workforce
  • Multi-discipline Logix
  • Energy Transition Capabilities

FY24 PROGRESS


  • Double-digit growth in Cybersecurity Services with expanding customer base
  • Growth in Process applications with multi-discipline Logix, including Process safety / HA
  • Energy end markets are ~15% of total ROK, grew mid single digits YOY in FY24
Share growth and expanded market
Chevron DownChevron Down

Customer Needs


  • Shoring / Stimulus / Mega Projects
  • Software-defined Automation
  • Autonomous Operations
  • Capacity Build-out in Focus Industries
  • Manufacturing Lifecycle Mgmt

Example of ROK Differentiation


  • ROK Ecosystem Evolution
  • Scalable Solutions & Business Models
  • AI-enabled Design, Control & Logistics
  • Industry-specific Solutions
  • Simplified Digital Threads

FY24 PROGRESS


  • Full capabilities in Integrated Control & Information
  • Continued share gains; Leader in NA PLC market
  • High win rate of New Capacity projects in FY24 and a robust pipeline of shoring/stimulus/mega projects into FY25 and beyond
World

Market Leader in North America

We have the highest share, largest installed base, best channel, and deepest relationships

  • We are winning at a high rate
  • OEMs outside of the U.S. want to work with ROK as the leader in the Americas
  • A substantial amount of mega projects are in our core verticals
  • Still in early innings of multi-year investment
ARR (Recurring Software & Services)
Chevron DownChevron Down

Customer Needs


  • Flexible & Scalable Data Mgmt

Example of ROK Differentiation


  • Edge & Cloud Portfolio

FY24 PROGRESS


Edge and Cloud portfolio driving market-beating ARR performance:

  • Continued double-digit YOY growth 
  • ARR is now over 10% of total ROK revenue
Acquisitions
Chevron DownChevron Down

Key Priorities


  • Annual Recurring Revenue
  • Market expansion in Europe and Asia
  • Application-specific technology in focus industries

FY24 PROGRESS


  • More than doubled Clearpath OTTO AMR revenue in FY24
  • Sensia profitability contributed to Lifecycle Services margin expansion
  • Expanding geographic footprint and data center business with CUBIC

TOTAL ANNUAL GROWTH THROUGH THE CYCLE

LONG-TERM
FINANCIAL FRAMEWORK

  • 35% core earnings conversion
  • EPS growth > sales growth
  • FCF conversion ~100%
  • ROIC > 20%
  • Target 2x leverage

Margin Expansion

  Margin Growth Drivers Long-term Range*
Intelligent Devices
  • Share gain from next gen product launches across core platform
  • Further synergies from recent acquisitions
  • Product cost optimization
22% - 24%
Software & Control
  • Continued share gains in Control
  • Further synergies from recent acquisitions
  • Higher software mix accelerated by key product launches
31% - 34%
Lifecycle Services
  • Focus on high-growth recurring services
  • Streamlined organization for faster growth
  • Improved growth and profitability of Sensia
13% - 15%
Total ROK Productivity Supply chain improvement Accelerated top line growth

*Excludes impact of future acquisitions

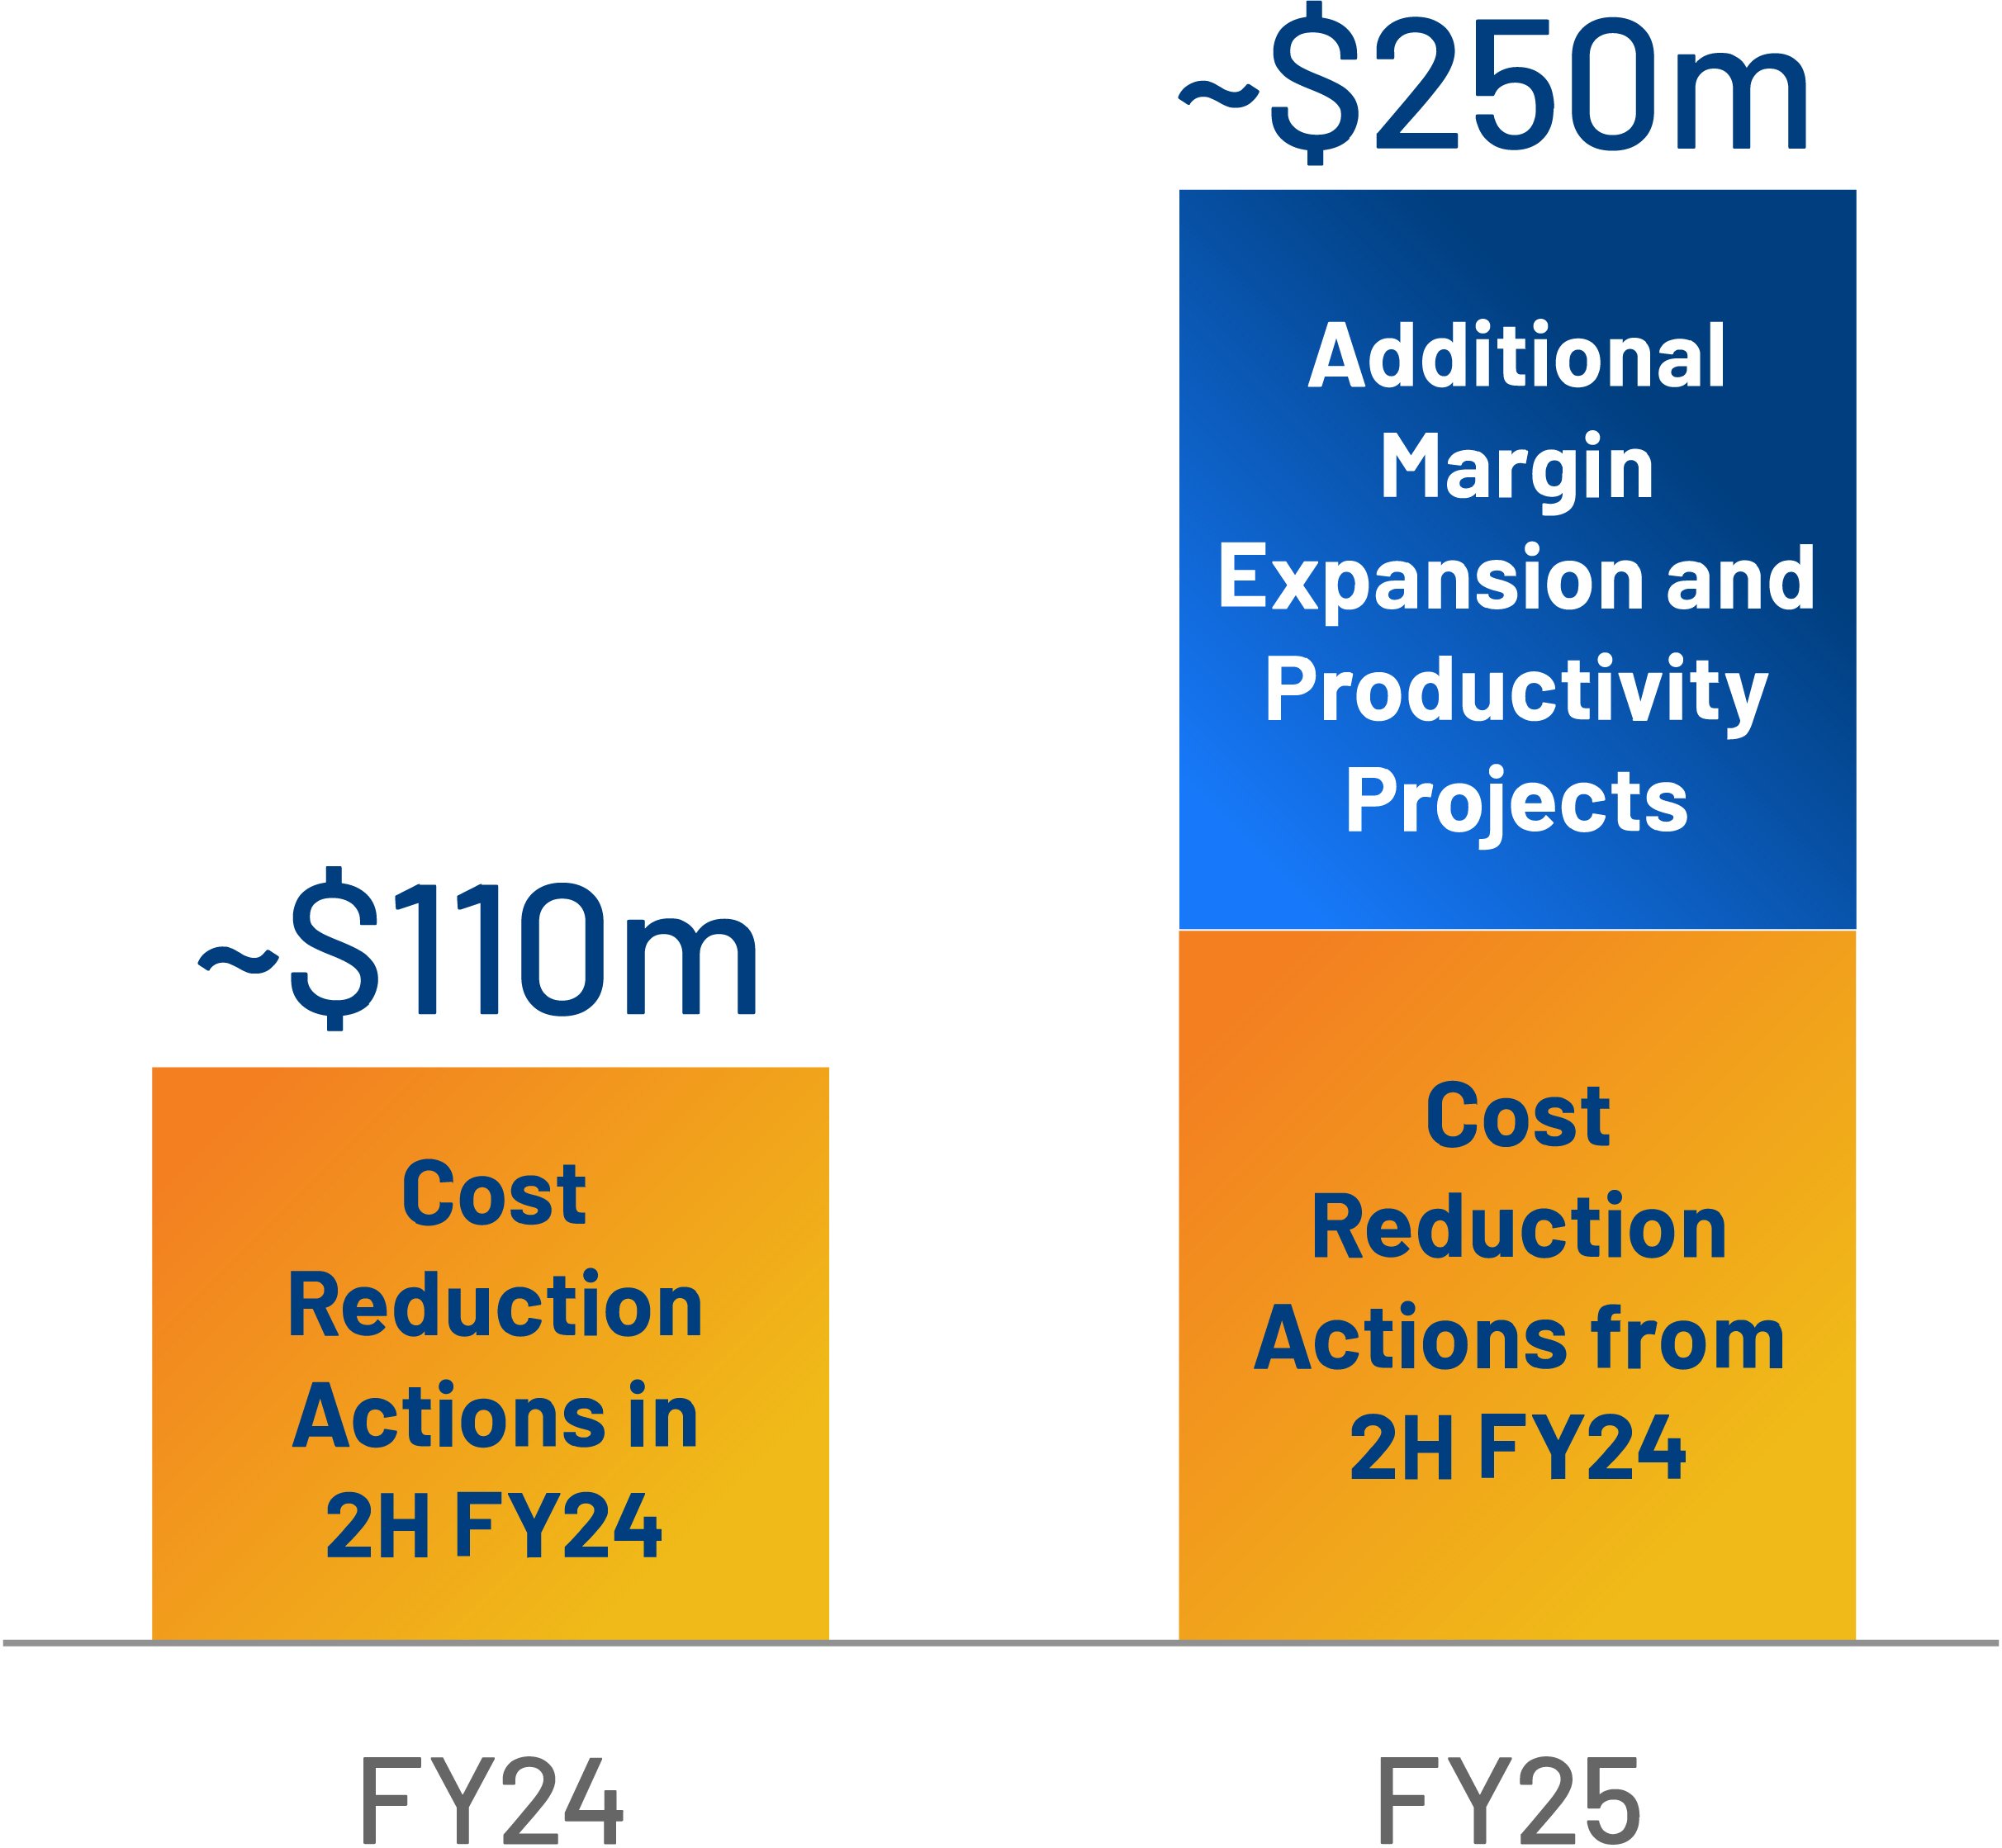
Margin Expansion and Productivity

ROK Operating Model to drive margin expansion and productivity through FY25 and beyond

Enterprise Scale and Efficiency SG&A Cost Reduction
  • Drive synergies from recent acquisitions
  • Productivity in HQ functions
  • Streamline sales operations
  • Leverage CoEs in low-cost locations 
Process Efficiency  Leverage technology to redesign processes and reduce manual work
Product Cost Reductions Direct Material Sourcing Supplier consolidation and negotiation
Product Redesign  Design changes to improve cost and manufacturability
Indirect and Supply Chain Optimization Indirect Sourcing Supplier negotiation and optimization of IT & outside engineering spend
Logistics Shift from air to ocean where applicable; logistic supplier negotiation
Manufacturing Efficiency Process improvement to increase yield and reduce manufacturing costs
Real Estate Footprint Space optimization and elimination of low utilization facilities 
Portfolio Optimization SKU Rationalization Reduction of low volume/low margin SKUs
Price Optimization Increase price on low volume SKUs
Enterprise Scale and Efficiency
SG&A Cost Reduction
  • Drive synergies from recent acquisitions
  • Productivity in HQ functions
  • Streamline sales operations
  • Leverage CoEs in low-cost locations 
Process Efficiency Leverage technology to redesign processes and reduce manual work
Product Cost Reductions
Direct Material Sourcing Supplier consolidation and negotiation
Product Redesign Design changes to improve cost and manufacturability
Indirect and Supply Chain Optimization
Indirect Sourcing Supplier negotiation and optimization of IT & outside engineering spend
Logistics Shift from air to ocean where applicable; logistic supplier negotiation
Manufacturing Efficiency Process improvement to increase yield and reduce manufacturing costs
Real Estate Footprint Space optimization and elimination of low utilization facilities 
Portfolio Optimization
SKU Rationalization Reduction of low volume/low margin SKUs
Price Optimization Increase price on low volume SKUs

Incremental YOY Benefit

Incremental YOY Benefit

Inorganic Investments
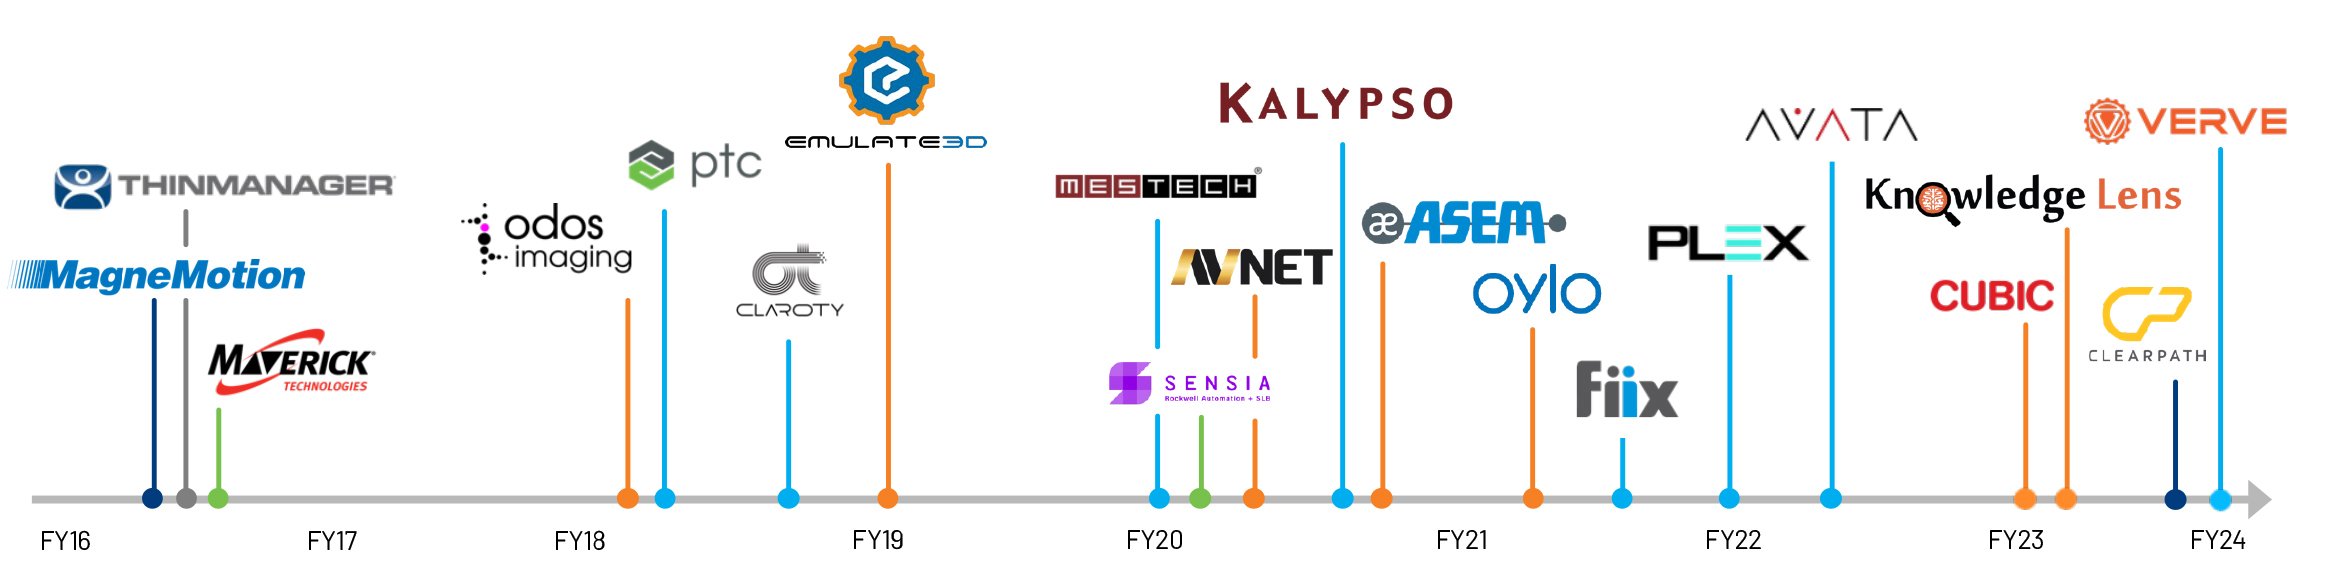
Inorganic investments timeline

New inorganic
priorities

  • Annual Recurring Revenue
  • Market Access in Europe / Asia
  • Application-specific Technology in Focus Industries

Prior inorganic
priorities

Process Expertise

Information Solutions / Connected Services

Market Access in Europe / Asia

Advanced Material Handling

Capital Deployment

Our strong balance sheet provides us with significant flexibility and capacity to deploy capital. Our capital deployment priorities have not changed: make investments to fund organic growth, drive a point or more per year of growth from strategic acquisitions, and return excess cash to shareowners through dividends and share repurchases.

ORGANIC INVESTMENTS


Operating Cash Flow

Capital Expenditures

~2 to 3% of Sales

Free Cash Flow

~100% of Adjusted Income

INORGANIC INVESTMENTS


Acquisitions

Target ~1 pt of growth per year

EXCESS CASH RETURNED TO SHAREOWNERS


Dividends

Maintain “A” credit rating

Share Repurchases

Framework for Continued Superior Financial Returns

Our longer-term framework for financial performance starts with organic sales growth, which drives earnings conversion (incremental margins). Free cash flow conversion of 100% or more and a strong balance sheet provide significant capacity for strategic capital deployment, including acquisitions and share repurchases. As a result, we expect EPS growth to outpace revenue growth and ROIC to remain over 20%.

35% earnings conversion at mid-single-digit organic growth
100% free cash flow conversion
ROK Solid balance sheet
EPS growth > revenue growth
ROIC > 20%

Addressing $500M in direct material spend by executing targeted contract reviews across key product portfolios

Achieving up to 30% cost savings in key categories by detailed product teardowns and component level should cost modeling

Renegotiating contracts + Consolidating suppliers to reduce cost, improve payment terms, and enhance service agreements

  • Cut subscription costs by 15% with a large supplier

Converted five of the highest volume shipping lanes to achieve >50% reduction in overall cost

Revised pricing on over 2,000 low margin SKUs in North America

  1. Chevron LeftChevron Left Rockwell Automation Startseite Chevron RightChevron Right
  2. Chevron LeftChevron Left Unternehmen Chevron RightChevron Right
  3. Chevron LeftChevron Left Investor Relations Chevron RightChevron Right
  4. Chevron LeftChevron Left Financial Overview Chevron RightChevron Right
Bitte aktualisieren Sie Ihre Cookie-Einstellungen, um fortzufahren.
Für diese Funktion sind Cookies erforderlich, um Ihr Erlebnis zu verbessern. Bitte aktualisieren Sie Ihre Einstellungen, um diese Cookies zuzulassen:
  • Social-Media-Cookies
  • Funktionale Cookies
  • Leistungscookies
  • Marketing-Cookies
  • Alle Cookies
Sie können Ihre Einstellungen jederzeit aktualisieren. Weitere Informationen finden Sie in unserem Datenschutzrichtlinie
CloseClose