Pivot Table
In a Pivot Table, Users can select the values of the columns, rows and values.
Users can filter, sort, group and aggregate the values of their choice click any value within the Pivot cells to display a data table with more details.
Perform the following steps to create a Pivot Table:
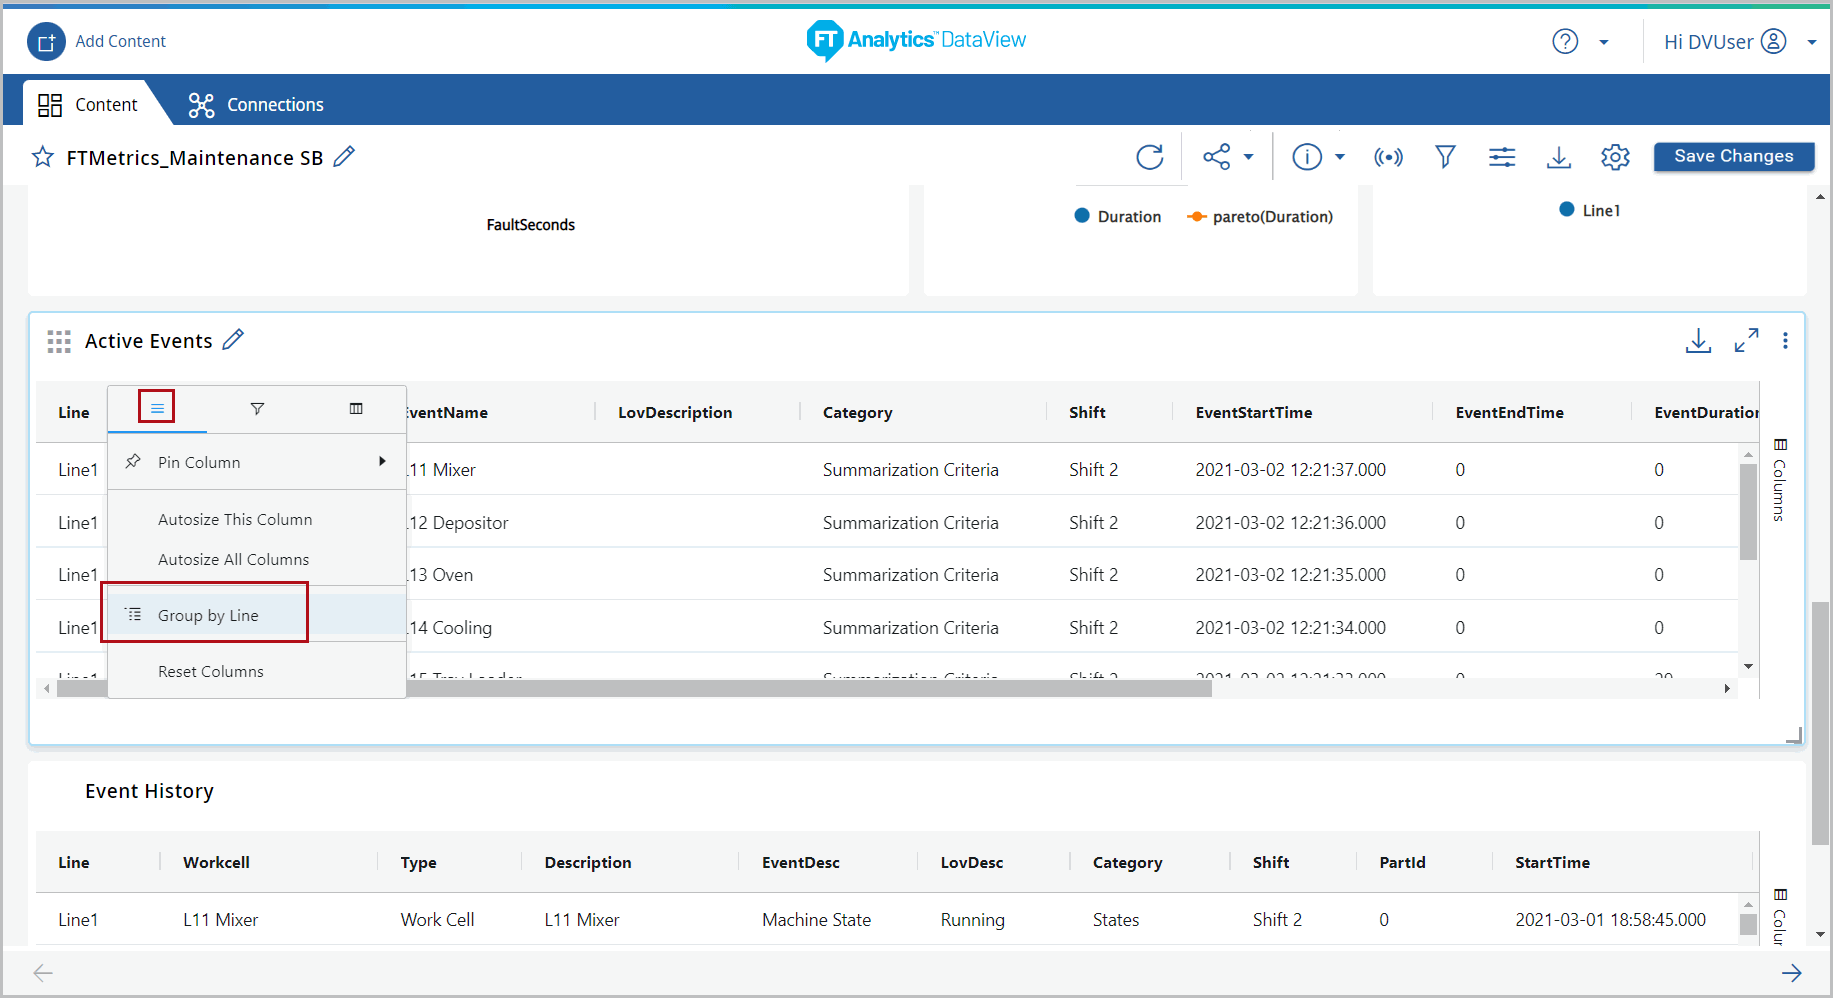
- Hover the mouse over the desired column header of the Data Table and click the [
 ] icon.
 - Select the [Group By “<Column_Name>”] to group the columns.Group Columns
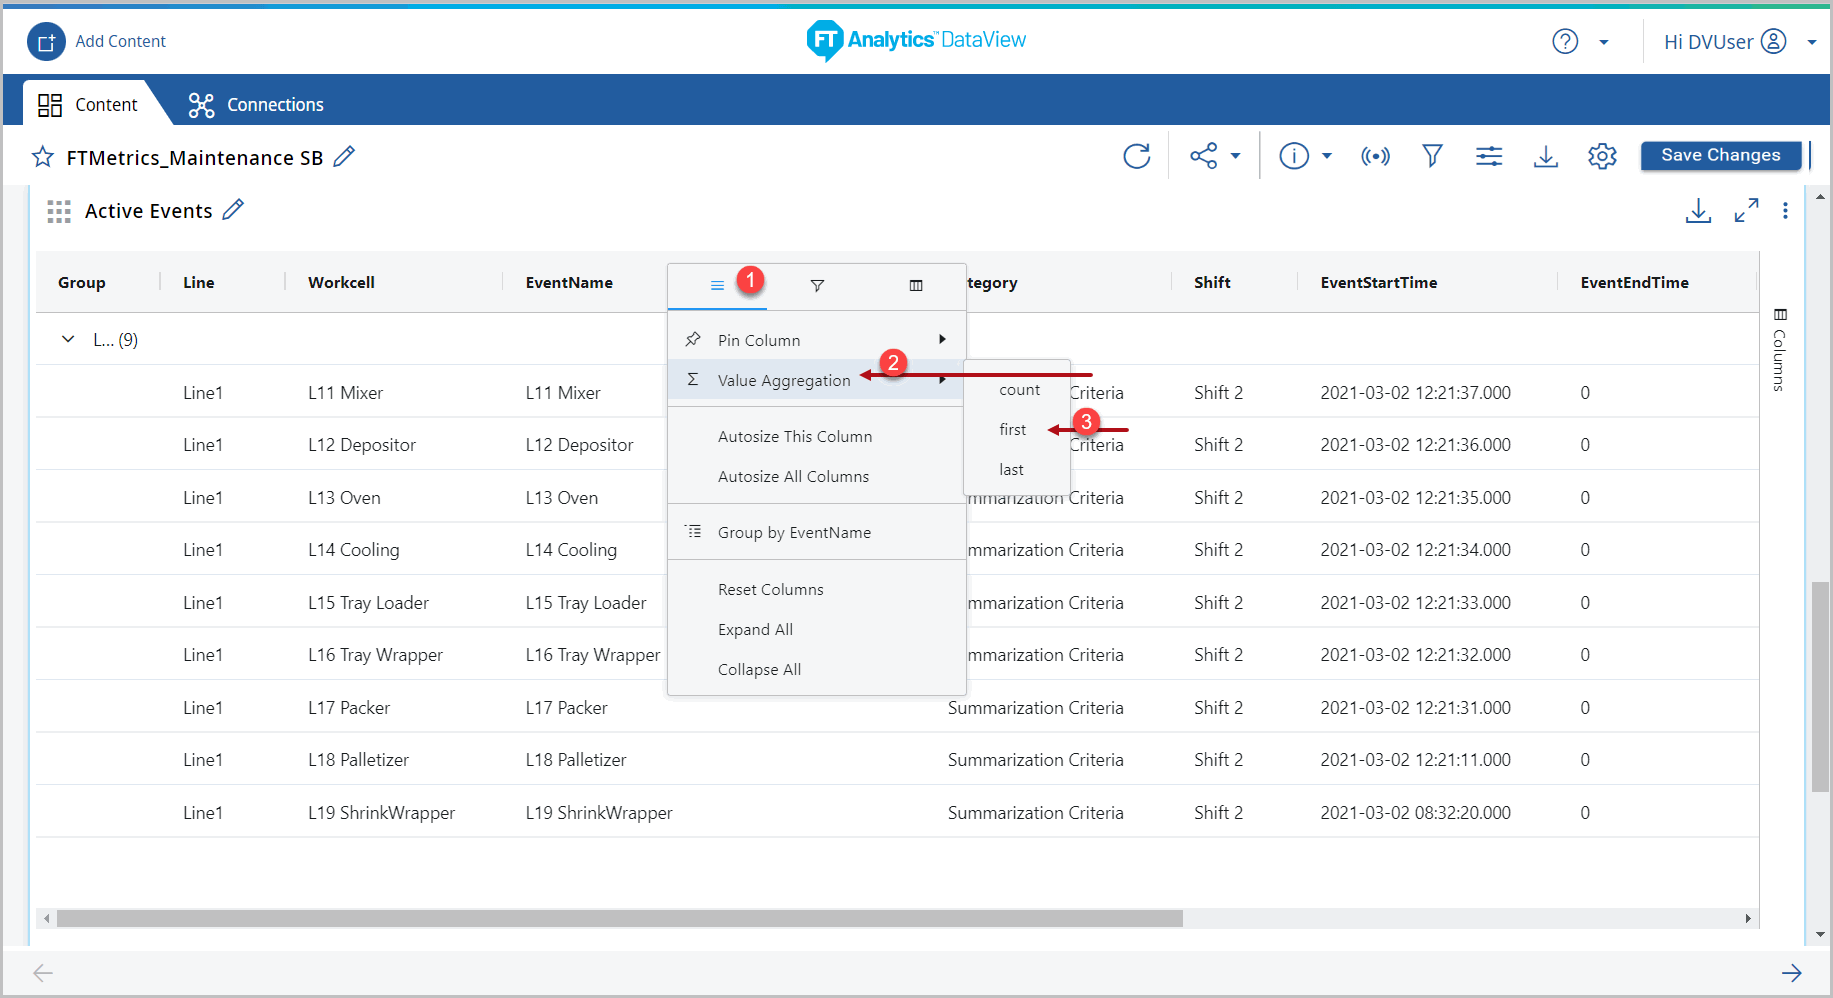
- Hover the mouse over the desired column header and click the [] icon.
- Click [Value Aggregation].
- Select the desired aggregation.Select Aggregation Columns
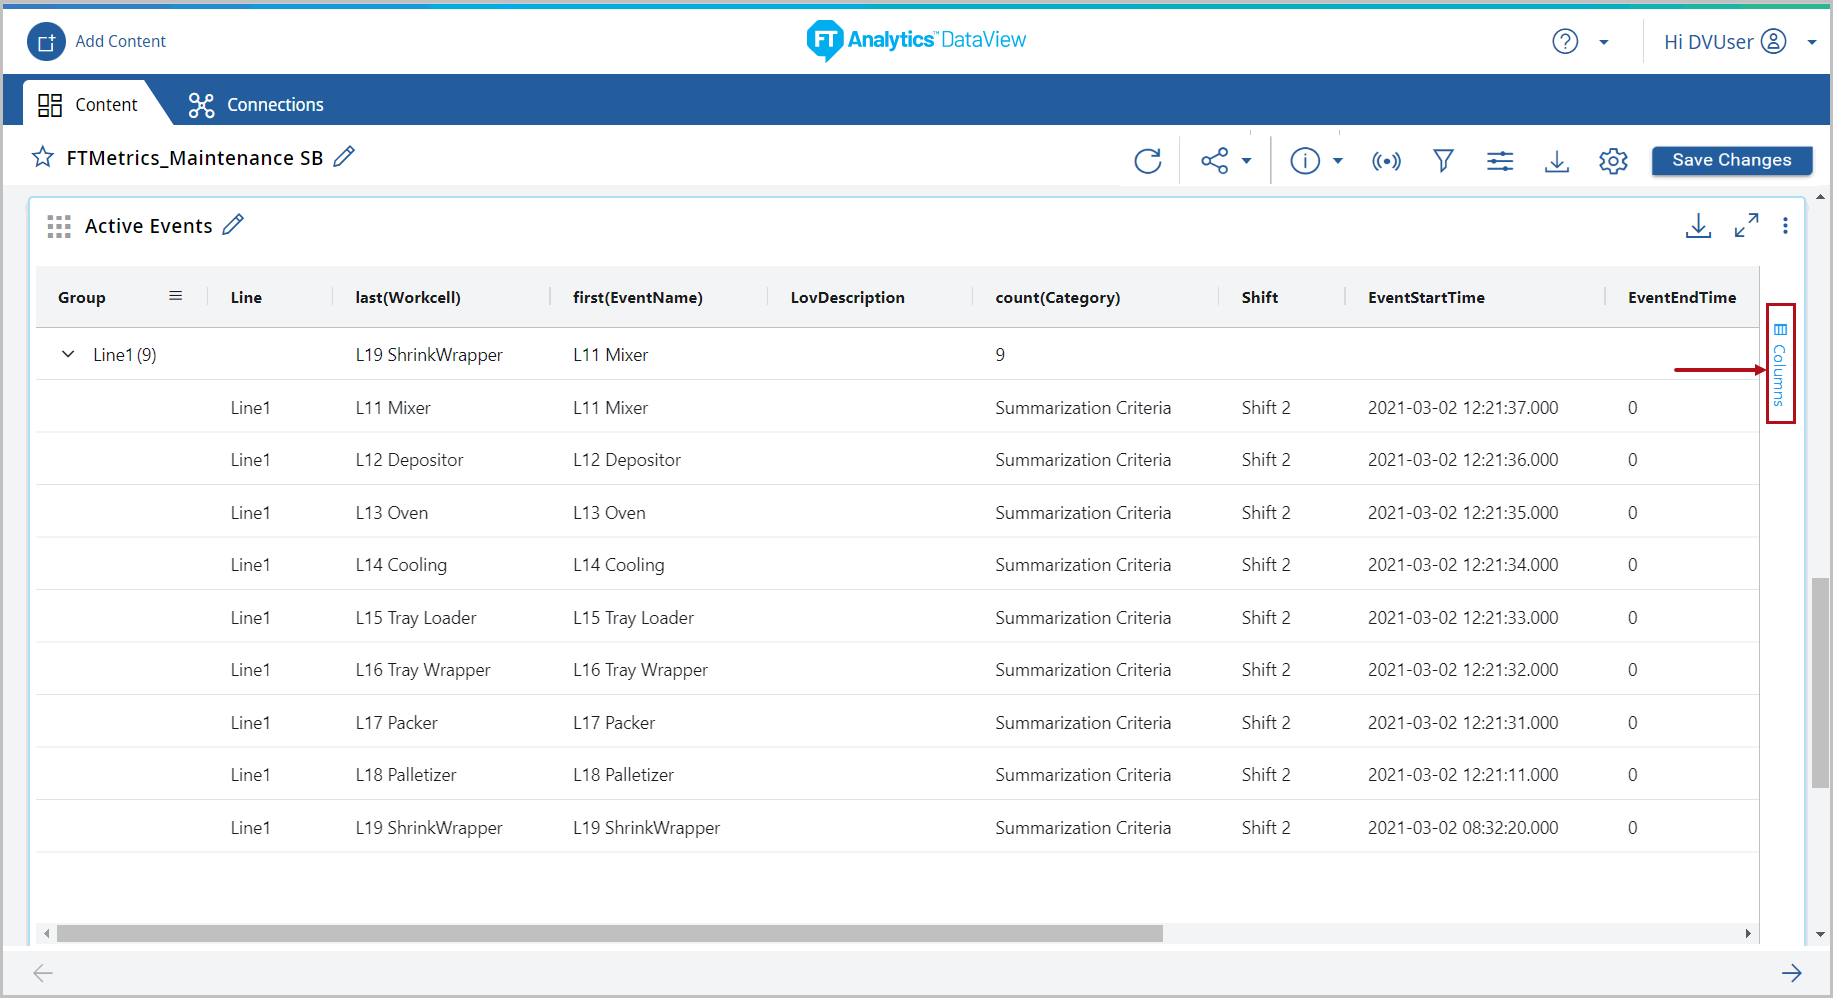
- Apply aggregation on multiple columns to pivot.
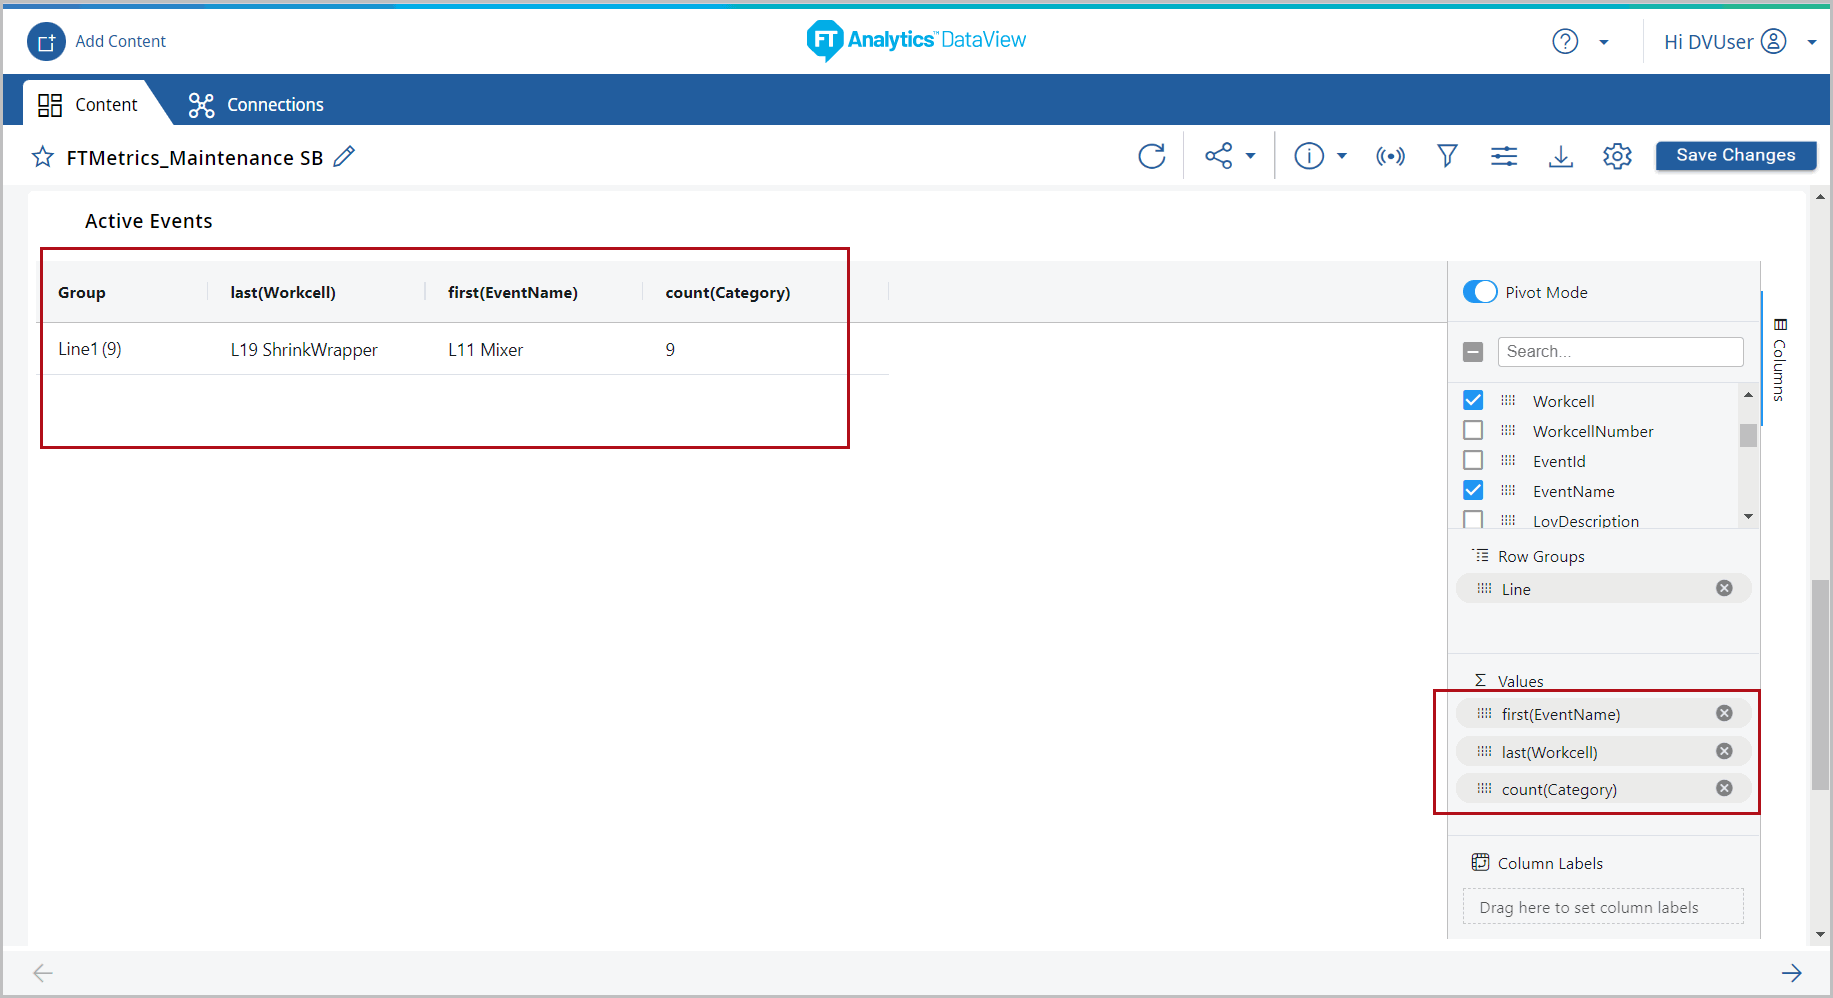
- Click the [] (Columns) icon.Columns
- The Pivot settings panel displays. Toggle the [Pivot Mode] option using the slider to enable the Pivot Table.Pivot Mode
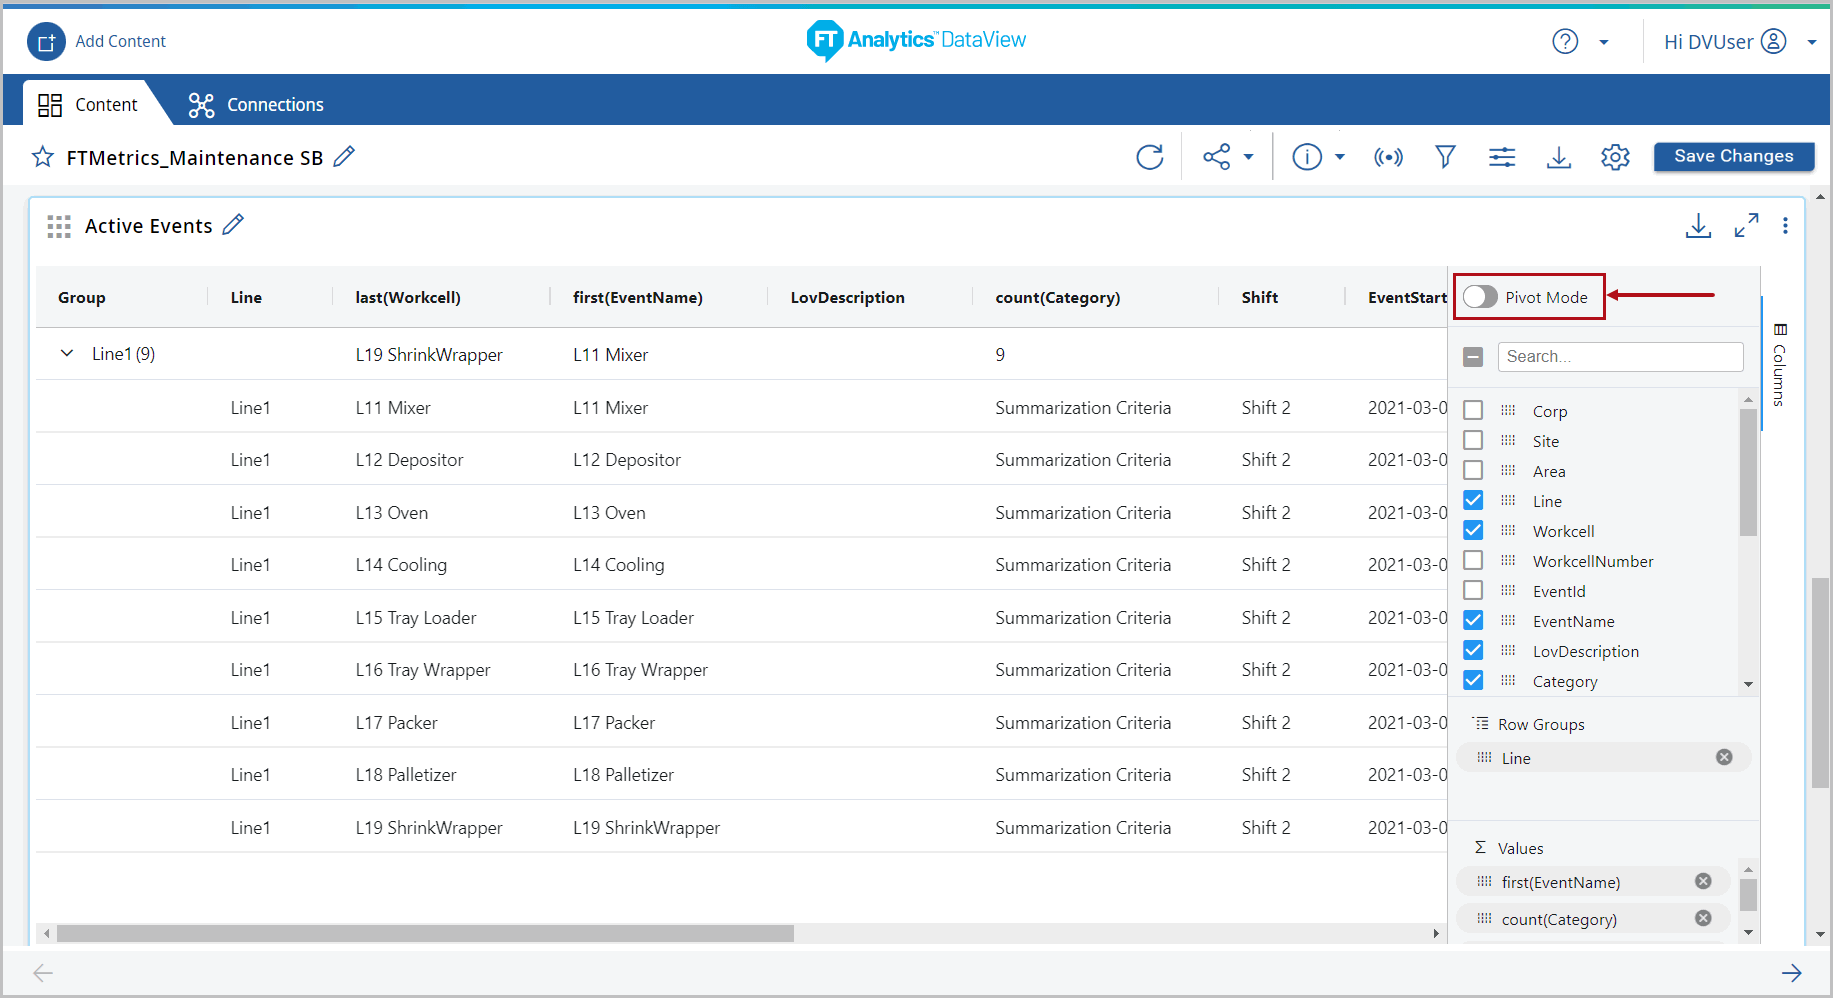
- The rows and columns are sorted as per the grouped columns and aggregation applied on the columns.Pivot Table
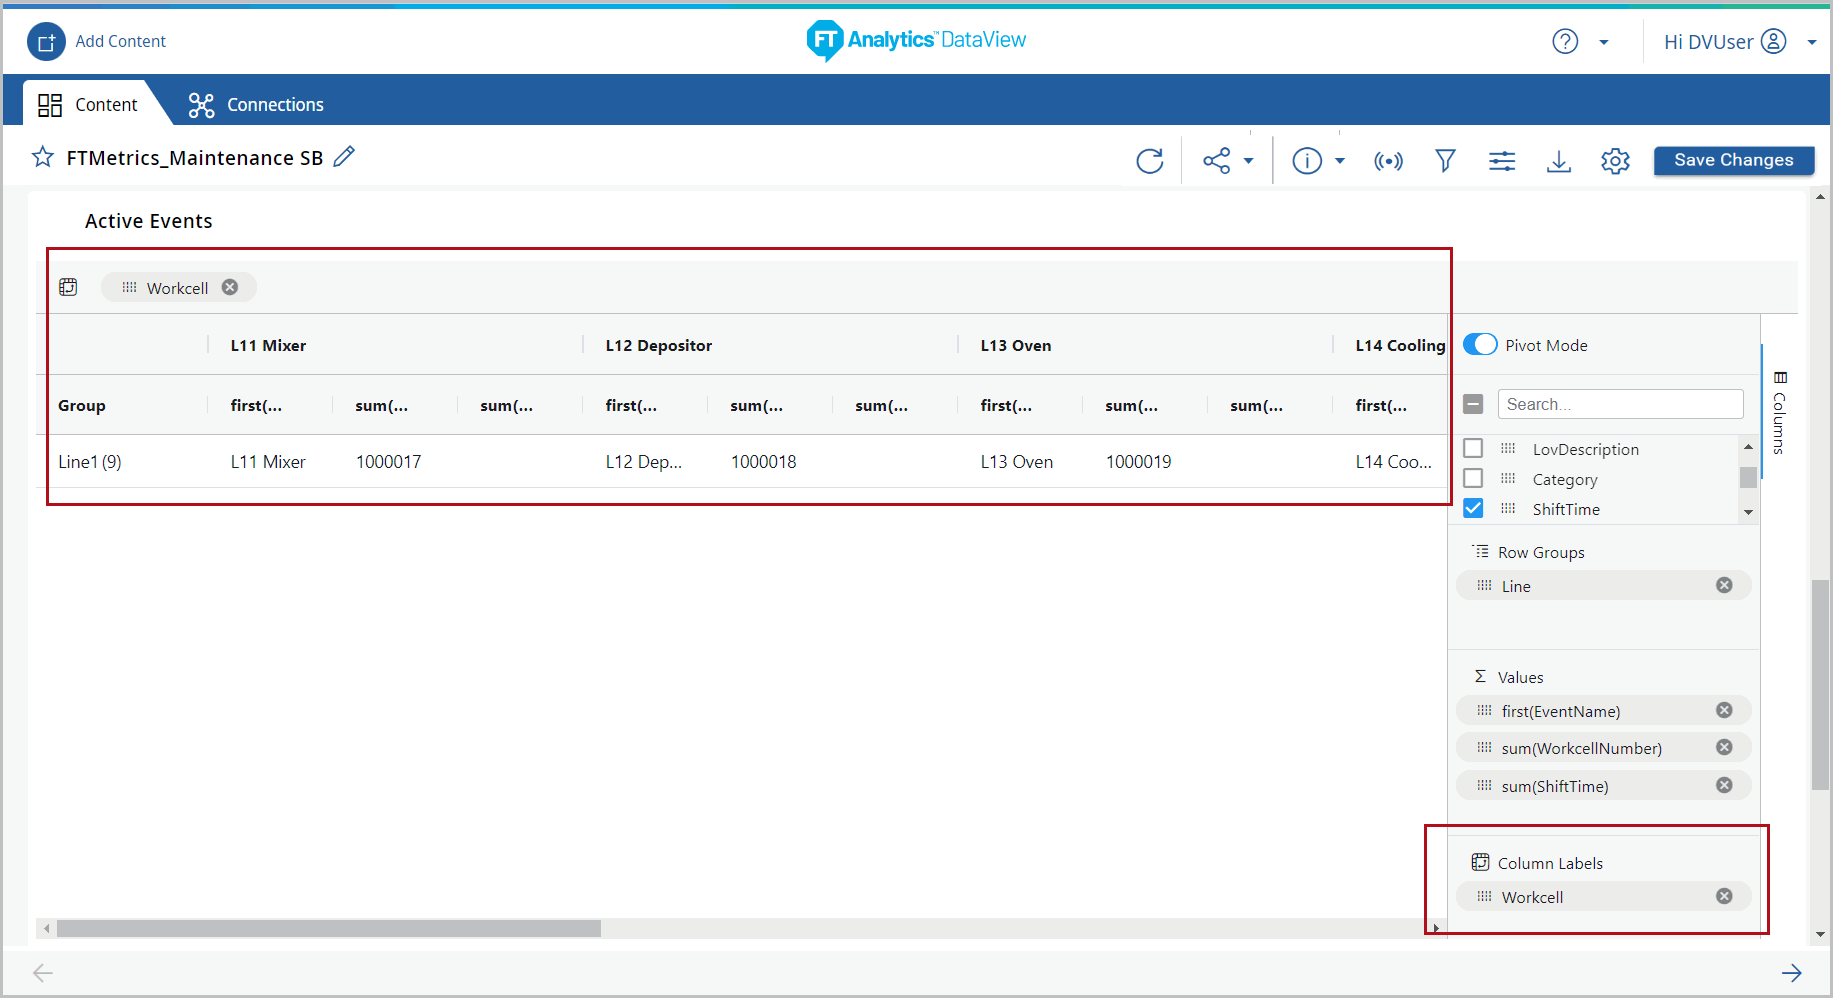
- Drag and drop the column(s) to [Column Labels] pivot the chart.Select Column Label
Provide Feedback