Manifest
After your data is imported and Data Explorer is launched, the view opened initially is called the manifest and contains a list of variables in the dataset as well as key statistics. From this view you can access other dataset configurations.
NOTE:
Row and column numbers in the dataset do not necessarily correspond to row and column numbers in the raw data file(s) as displayed in the importer.
Populated Data Explorer Manifest
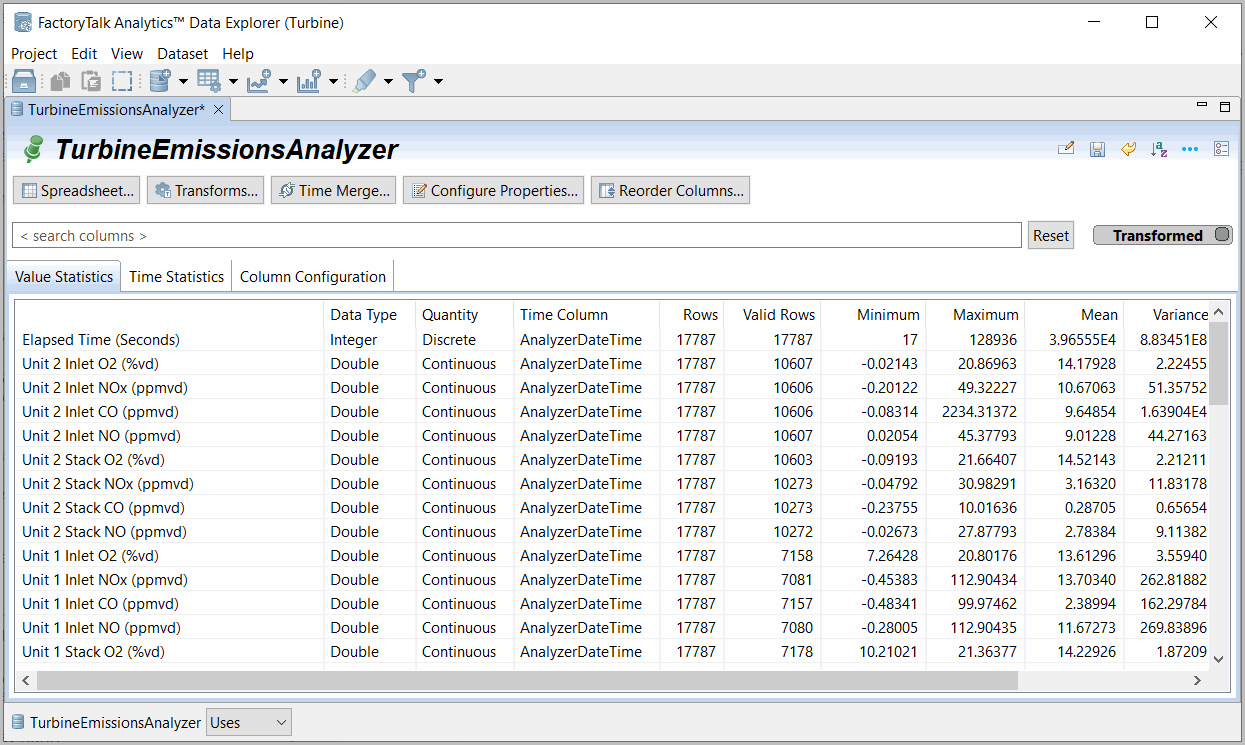
The Data Explorer manifest contains the following tabs:
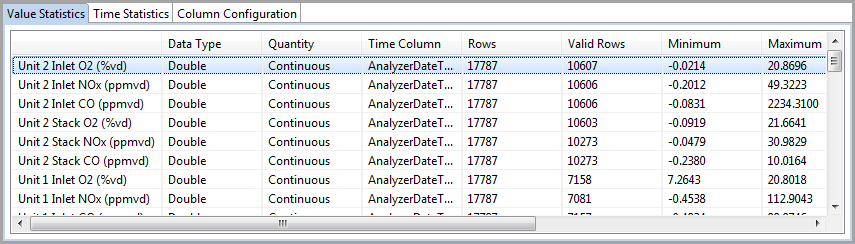
- Value Statistics: use this tab to view statistics for either the transformed or raw data. Each column contains a single variable (if any date and time information was in separate columns in the importer, it is automatically combined into a single date/time column). Header information about a variable is displayed at the top of a column, above the data values.Examine the minimum and maximum of each variable to make sure they are reasonable values, and potentially identify any values that are obviously invalid. In many cases it can be useful to view mean and standard deviation as well to be sure that the data is representative of a known state of your process.String variables have no additional statistics, and date/time variables have only min and max (see the Time Statistics tab for more information on date/time variables).Variables can be renamed, duplicated or deleted with the manifest right-click options > Rename, Duplicate or Delete. Click the [...] icon in the top right corner for the Advanced statistics beyond the basic list.
Value Statistics Tab
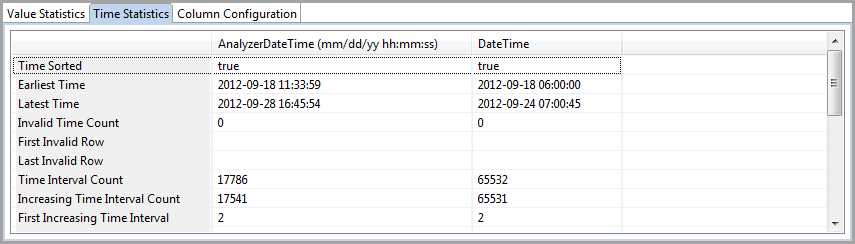
- Time Statistics: use this tab to view information about the date/time variables in your dataset. You can select either the after-transforms (normal) or before-transforms state of the dataset. The information includes the location of invalid values, and the numbers, location, and size of increasing, constant, and decreasing intervals.
Time Statistics Tab
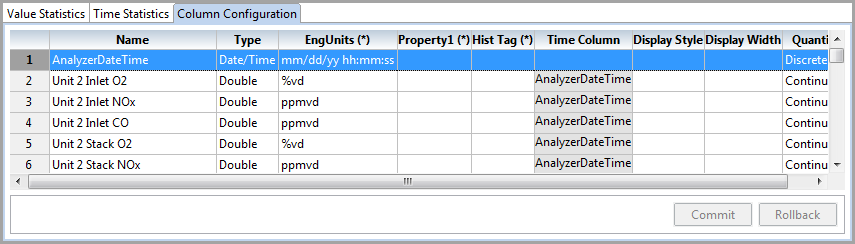
- Column Configuration: use this tab to view the columns as defined before you imported your dataset as well as edit properties, the Display Style/Width configuration, and the Quantity and Time Column for raw variables. The default values for the Display columns are set from the menu bar at Edit > Display Preferences.
Column Configuration Tab
When you right-click in the data table (multi-select via Alt- or Ctrl- click is supported) in either the Value Statistics or Column Configuration tabs, you have options to do the following:
- Plot: plot your data on a variety of graphical chart types (trend, overlay, XY, carousel, or raw vs. transform). This option for any selected dataset data can also be performed using the Plot icon.See “Plotting Data” for more details.
- Analyze: analyze your data using a variety of statistical chart types (histogram, correlation, ranked correlation, delay correlation, or statistics). This option can also be performed using the Analyze icon. See Chapter 4, “Analyze Data” for more information.
- Cut: cut unnecessary data. Data can be cut above or below (or both) a certain level within selected rows or date/times. See “Cutting Data” for more details.
- Filter: filter the data. This allows data related to complex (and/or/not) logic to select or exclude data around any variable condition or condition set. See “Filtering Data” for more details.
- Highlight/Unhighlight: adds or removes a highlight that can be based on any of the data values, row numbers, times, or data status on the selected variable(s).Filtering is defined logically or reproduced from highlight data. Highlighting is generally specified graphically in a series of steps or actions.
- Transform: To transform the data. Transforms are generally functional adaptions of data or generation of new enrichment variables using a broad range of date/time, string, or available math functions in a program-less toolset. See Chapter , “Manage Transformed Data” for more details.
- Export: To export the data to a CSV spreadsheet (and calculation script if selected) with formatting options.
- Virtual Online Analyzer (TM): Selects input and output variables for developing a physics-based or empirical lab quality inferential model (for example, a streaming lab estimate).
- Rename: rename the dataset variable.
- Duplicate Column (Raw): copies any variable into a new Raw column, which is then treated as if it had been imported with the original data.
- Delete: delete the data variable from the dataset.
- Add New Variables: Opens up new or previously loaded dataset file (csv, xls) to import additional data to be integrated as new columns (new variables) in the open dataset.
- Add New Rows: Opens up a new dataset file (csv, xls) to import additional data to be integrated as new rows (new time ranges) to the bottom of the open dataset.
IMPORTANT: Add New Variables will automatically unselect variables with identical Column Names as existing variables. If desired the user must manually select and rename these columns. It is normally not desired to add duplicate columns, but you will at a minimum want to select and rename DateTime Columns even with initially duplicate names. Renaming (Example: "_2") will be required.
The manifest uses the following icons:
Icon | Description |
|---|---|
Click the Pin icon to pin a tab. Pinned tabs are retained as part of the project set-up and can be recovered if closed by clicking the Open Projects Window icon and selecting the desired, pinned tab (plots, datasets, analysis, filters, and exports). | |
Click the Rename icon to rename your artifacts. You can also rename an artifact by double-clicking on its name. | |
Click the Save icon to save changes to your artifacts. | |
Click the Revert to Last Saved icon to discard any unsaved changes in the current artifact. Unsaved changes | |
Click the Sort Alphabetically to sort from A-Z. Click the icon again to undo the original sort and return to the previous order. By default, variable order is in the order of the imported data files. | |
Show Advanced Statistics (toggle) to include quartile and skew/kurtosis information. | |
Open Preferences for this function for context focused settings. | |
Enter a search term to filter through the data. The data will filter as you type in the term. Click [Reset] to display all the data again | |
Click to toggle between viewing transformed data and raw data. Transformed data is shown by default. |
Provide Feedback