Enterprise Level Dashboard
You can view the performance and energy charts of all the sites under Regions based on your time period selected from the date picker.
Perform the following steps to view, show/hide, and filter charts:
- Click the [
 ] icon from the menu bar and selectEnterprisefrom the hierarchy list.The following table provides the list of charts available by default in the dashboard:Chart TypesS.NoChart NameDescription1Total consumption widget (Harmonized)This is the overall summary of the total energy consumption.2Total cost widget (Harmonized)This is the overall summary of the total cost.3Total emission widget (Harmonized)This is the overall summary of the resource emission.4Total energy consumption chartYou can view the site details on the X-axis and harmonized consumption on the Y-axis. This chart shows the overall energy consumption summary.5Total production widget by Site-wiseThis chart shows the overall production summary of site-wise.6Total energy cost chartYou can view the site details on the X-axis and the cost on the Y-axis. This chart shows the overall energy cost site-wise.7Total emission chartYou can view the site details on the X-axis and the emission on the Y-axis. This chart shows the overall emission site-wise.8Total energy intensity chartYou can view the site details on the X-axis and energy intensity on the Y-axis. This chart shows the overall energy intensity summary site-wise.9Top 5 consumption, cost, and emission chartYou can view the resource details on the X-axis and attributes (Consumption, Cost, Emission) on the Y-axis. This chart shows the top 5 resources based on consumption, cost, and emission.NOTE:Click the [
 ] icon to view the chart in the widget view. Click the [
 ] icon to switch the view from widget to chart.Widget View
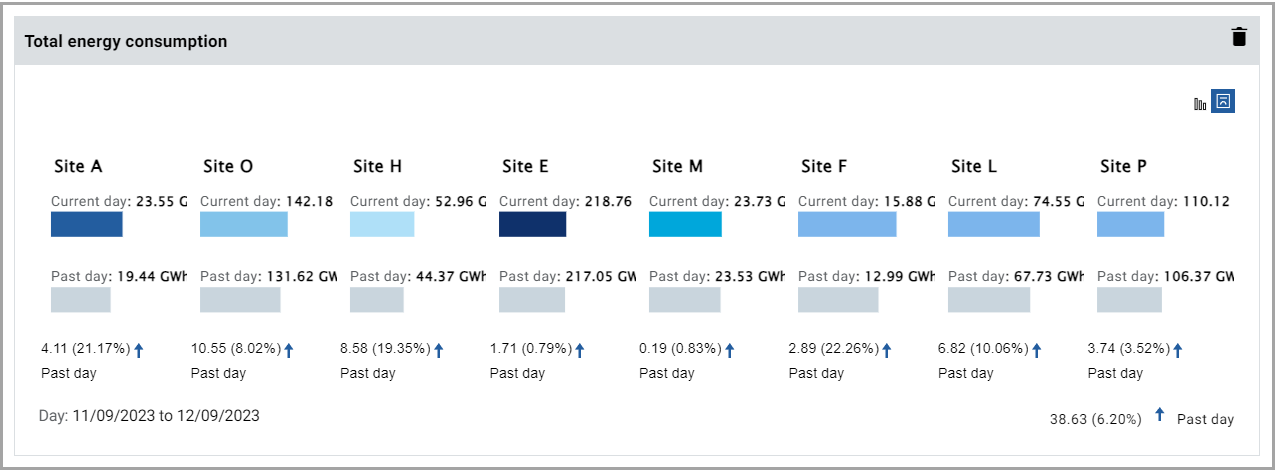 Chart View
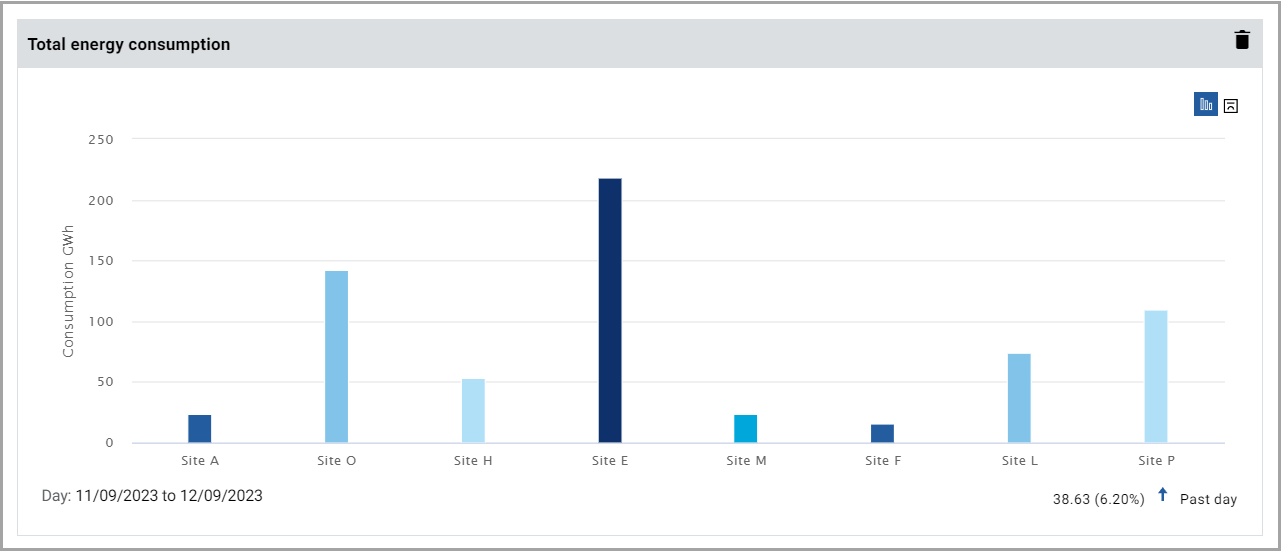
- To see the data, hover over the bar in the required chart.
- To remove the chart from the dashboard, click the [
 ] icon from the respective chart.
 - In theDelete chartdialog, click [Delete].Delete chart dialog
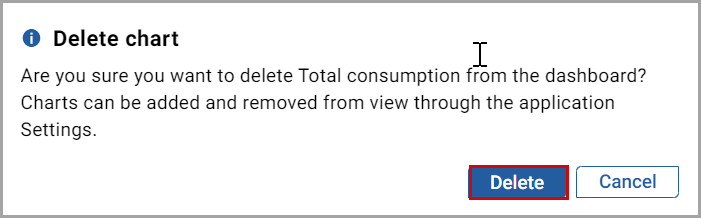 The "Chart remove successfully" message displays.
 - To add or show the chart in the dashboard, click the [
 ] icon from the top-right corner of the Enterprise dashboard.
 - Select the required chart check box to add to the dashboard and click [Save].Enterprise Dashboard chart settings
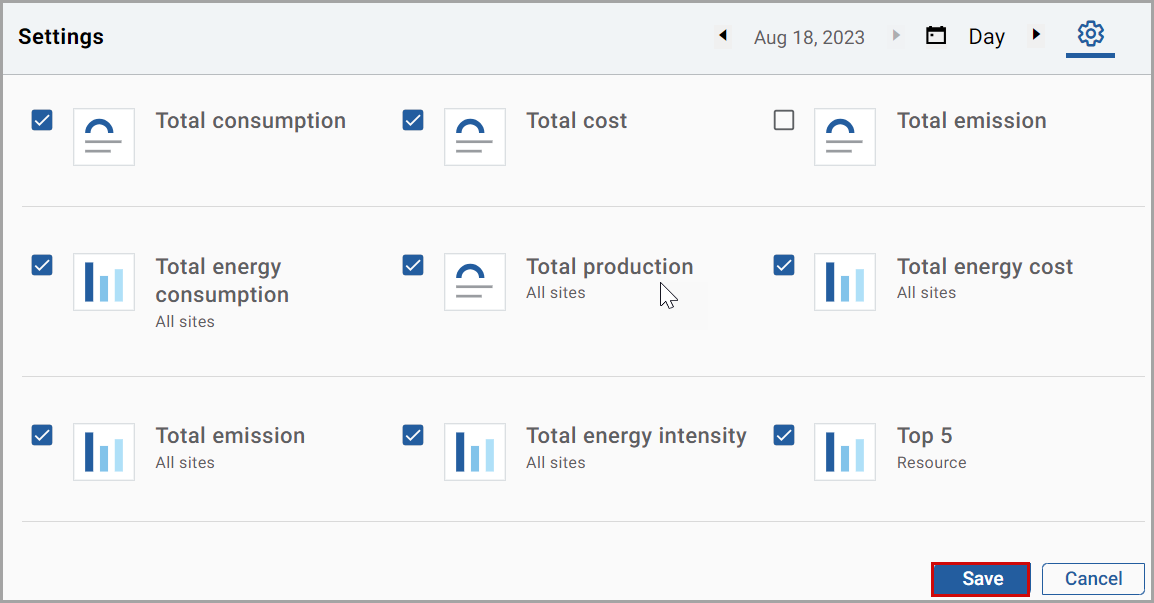 NOTE: To remove the chart from the dashboard, uncheck the required chart check box and click [Save].The “Dashboard setting changes updated successfully” message displays.
Perform the following steps to change the chart time period:
- Click the [
 ] icon.
 - Select theDateorWeekorMonthorYear, orCustomfrom the drop-down list and the calendar displays.
- Select the time period.
- Click the [] and [
 ] to move forward and backward period of the selected time period respectively.NOTE: If you selectCustomfrom the drop-down list, you need to select theFromandTodate and provide the time manually.
Related Links
Provide Feedback